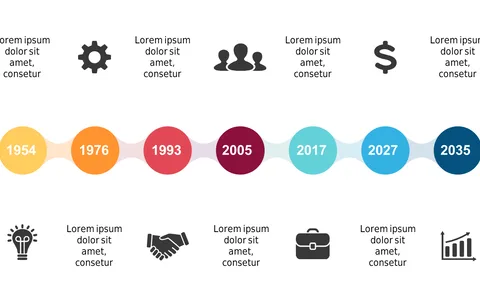
Present Milestones with Engaging Icons

Product Description
Communicating milestones can be overwhelming, particularly when trying to keep your audience engaged. This timeline slide takes your data and turns it into an eye-catching visual, featuring colorful icons that represent various achievements across different years.
This slide is perfect for product owners summarizing a project’s journey, marketing directors showcasing campaign results, or anyone needing to highlight progress in presentations. Imagine using it during a stakeholder update or an annual review when clarity is paramount.
For just $0.99, you can download this engaging slide instantly and customize it in PowerPoint or Google Slides. It’s built for easy edits, allowing you to present your accomplishments with confidence in minutes.
$0.99 – Purchase Checkout
Added to cart