Showcase Global Market Distribution with PowerPoint
Product Description
Delivering market data can often feel like trying to decode a foreign language. Without clear visuals, your audience may struggle to understand the distribution of your findings, leading to confusion and missed opportunities.
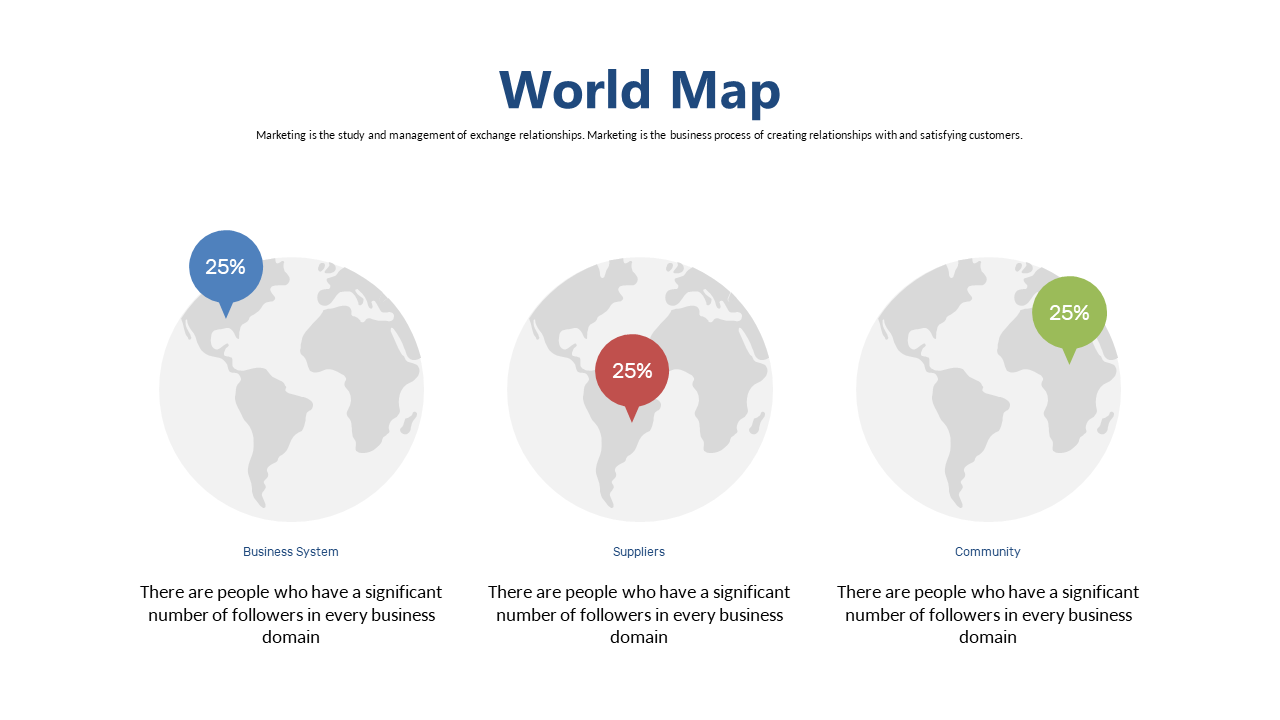
This slide presents a world map that visually divides the market data into segments, making your analysis accessible and engaging. This slide is perfect for market analysts who need to present data trends, product managers reporting on global sales, or business development teams exploring new markets. Whether you’re in a board meeting, sales pitch, or strategy session, using this map will help you effectively communicate critical insights about market distribution and opportunities.
At just $0.99, you can download this slide and quickly customize it in PowerPoint or Google Slides. It’s designed for immediate use, allowing you to focus on your presentation while conveying data in a visually appealing manner.
$0.99 – Purchase Checkout
Added to cart