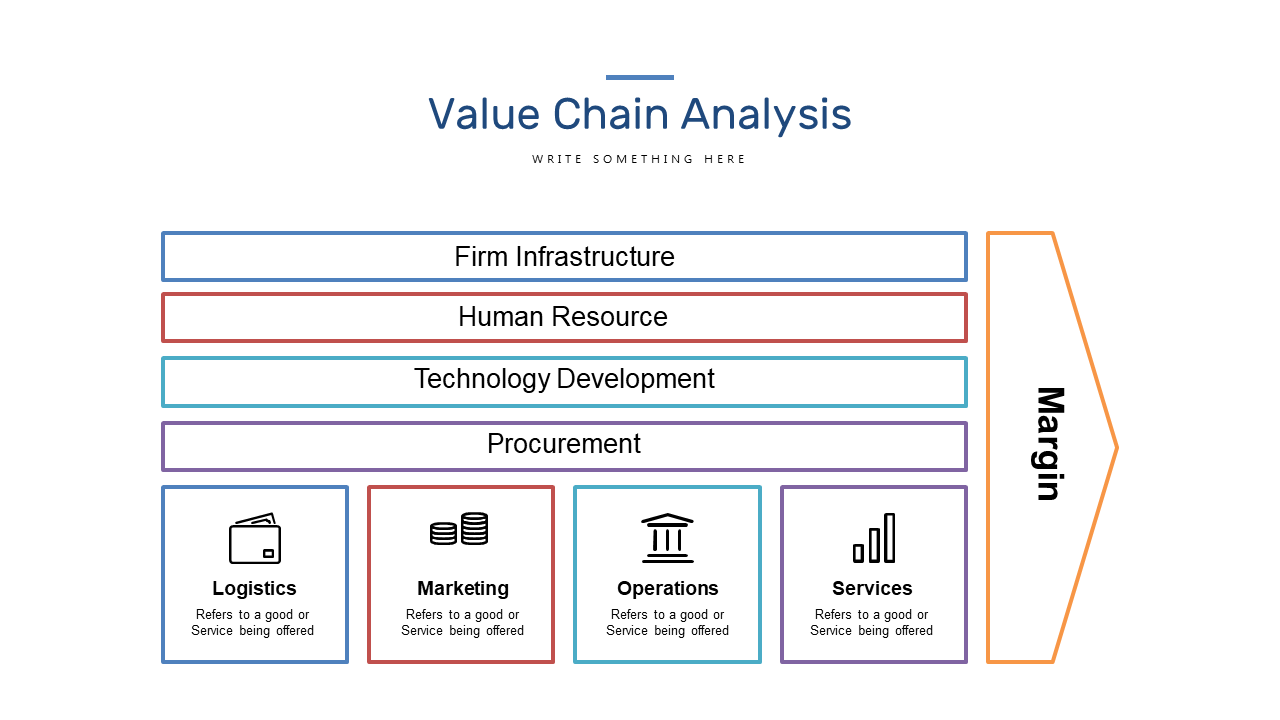
Explore Value Chain Analysis with Segmented Categories
Product Description
Marketing managers often struggle to convey detailed data in a way that resonates with their audience. Presenting multiple components of a value chain can be tedious without the right visual aid.
This slide simplifies the representation of elements like Firm Infrastructure and Service Delivery through segmented categories, making it easier for your audience to follow along. This slide is particularly useful for marketing professionals, data analysts, and project managers during presentations, workshops, or reports. It helps you break down complex concepts into digestible parts, enabling better understanding and engagement from your audience.
You can get this segmented value chain analysis slide for just $0.99, and it’s instantly downloadable. Edit it easily in PowerPoint or Google Slides and have it ready for your next presentation in a matter of minutes.
$0.99 – Purchase Checkout
Added to cart