Engage with a Colored Bubbles Timeline for Business Insights

Product Description
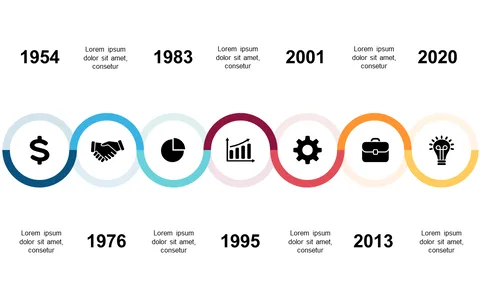
Presenting complex timelines can often cause confusion for your audience, especially when you need them to grasp significant information quickly. This slide tackles that issue by offering a visually engaging representation of your business insights through colorful speech bubble shapes that highlight various years and categories.
Consider a marketing manager preparing for a quarterly business review, or a project coordinator outlining a product launch timeline; this slide is perfect for those scenarios. It’s also great for sales teams discussing client milestones or executives sharing company growth at annual meetings, ensuring your message resonates with clarity.
At just $0.99, you can instantly download this slide, which is fully editable in PowerPoint and Google Slides. It’s designed for quick customization, so you can tailor it to fit your specific needs in minutes.
$0.99 – Purchase Checkout
Added to cart