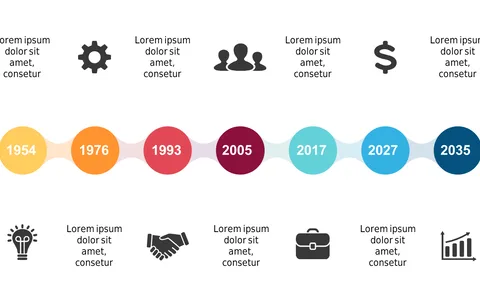
Present Milestones with a Horizontal Banner Timeline

Product Description
Keeping everyone informed about milestones and progress can often feel like an uphill battle. This horizontal banner timeline makes it straightforward to show your audience key events visually, helping to ensure that all parties are aligned and aware of project developments.
Whether you’re an operations manager reviewing quarterly goals, a team leader updating the group on project timelines, or a business analyst presenting historical data, this slide fits seamlessly into a variety of contexts. It’s perfect for updating stakeholders during meetings or developing a clear visual for reports.
Available for just $0.99, this slide can be instantly downloaded and easily edited in PowerPoint or Google Slides. You’ll have it customized and ready to share in just a few minutes.
$0.99 – Purchase Checkout
Added to cart