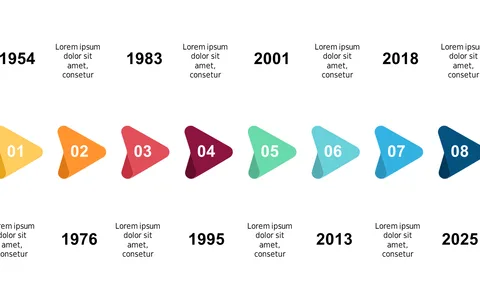
Visualize Multi-Year Milestones with a Hexagonal Timeline

Product Description
Juggling multiple projects over several years can lead to confusion when it comes time to communicate milestones. This slide alleviates that stress by breaking down your timeline into easily digestible parts.
With its hexagonal design, you can present complex timelines in a way that’s visually clear and engaging. Project managers and program directors in sectors like construction or IT will find this slide particularly beneficial during long-term planning meetings or quarterly reviews. Each hexagon allows you to highlight significant milestones, so everyone understands the project’s trajectory.
For only $0.99, you can download this slide instantly, making it simple to adapt for your specific needs. It’s ready to edit in both PowerPoint and Google Slides, giving you the flexibility to make changes right before your presentation.
$0.99 – Purchase Checkout
Added to cart