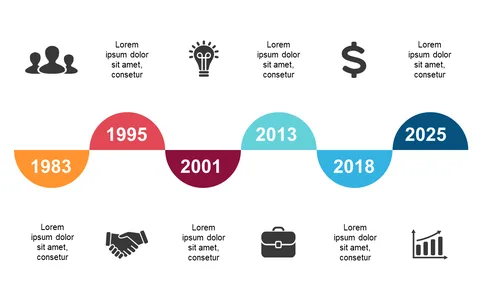
Showcase Milestones with Icons in a Horizontal Timeline

Product Description
Keeping everyone on the same page regarding milestones can be a daunting task, especially when details get lost in lengthy reports. A visual tool that highlights key events clearly can make all the difference.
This slide provides a straightforward horizontal timeline that makes tracking progress more intuitive. Operations managers and team leaders in various industries, like manufacturing or logistics, can use this slide during performance reviews or progress updates. The distinct icons represent each milestone, making it easy for your team to see where you are and what’s next in the project timeline.
At just $0.99, this slide is an instant download that you can edit to match your specific project. You’ll have it ready to go in PowerPoint or Google Slides, ensuring your presentation looks polished in minutes.
$0.99 – Purchase Checkout
Added to cart