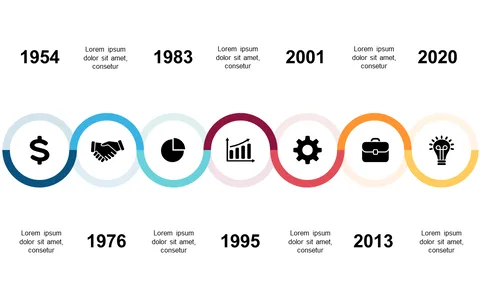
Present Business Milestones with a Colorful Timeline

Product Description
When it comes to showcasing important milestones, clarity and vibrancy matter. A colorful timeline serves to highlight these key events, making it easier for your audience to follow the story of your project’s progress.
This slide brings energy and focus to your presentation, ensuring that no milestone goes unnoticed. Business analysts, project managers, and sales leads across various sectors can benefit from this slide when presenting quarterly results, project updates, or strategic plans. It’s especially effective for teams needing to keep stakeholders engaged with the timeline of their accomplishments.
At just $0.99, this slide can be quickly downloaded and customized in PowerPoint or Google Slides. With minimal effort, you’ll create a visually appealing presentation that captures your audience’s attention from the start.
$0.99 – Purchase Checkout
Added to cart