Outline Project Management Phases with Infographic

Product Description
Having a clear outline of project management phases is key to keeping teams in sync and projects on schedule. However, detailing each phase can sometimes muddy the waters instead of clarifying them.
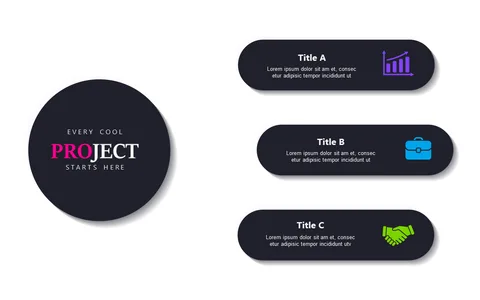
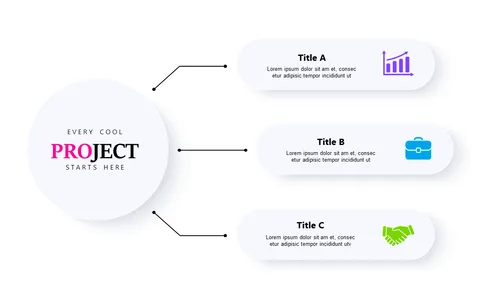
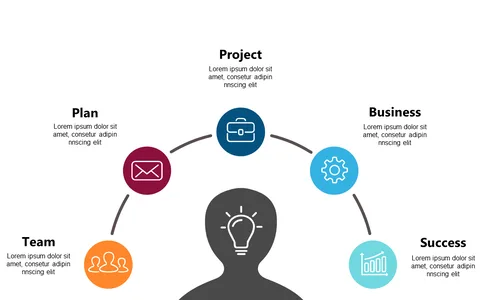
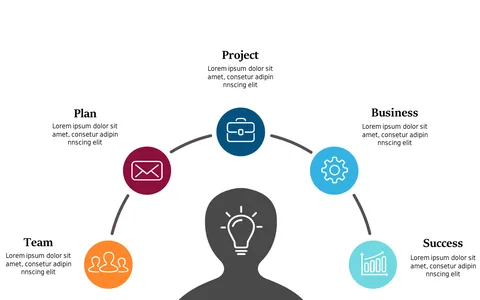
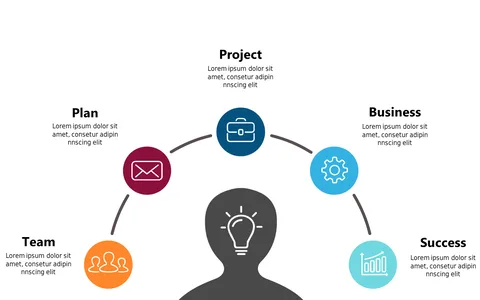
This infographic breaks down project stages into distinct segments, ensuring that everyone understands their tasks and objectives. This slide is particularly useful for project managers, team leaders, and consultants involved in industries such as finance, software development, or manufacturing. Use it during project kickoff meetings, strategy sessions, or progress reports to keep teams focused and informed.
At just $0.99, you can download this slide instantly and customize it in PowerPoint or Google Slides. It’s designed for quick and easy editing, helping you communicate project phases effectively and efficiently.
$0.99 – Purchase Checkout
Added to cart