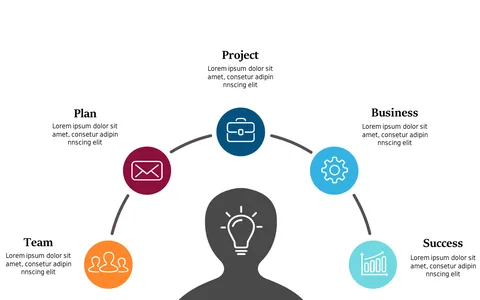
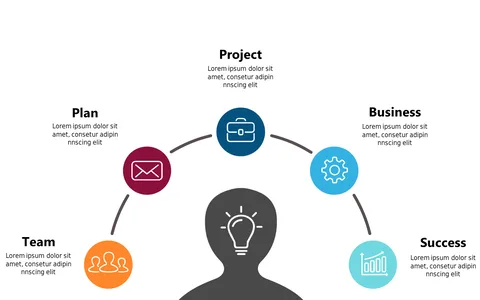
Customizable Hexagonal Project Life Cycle Stages
Product Description
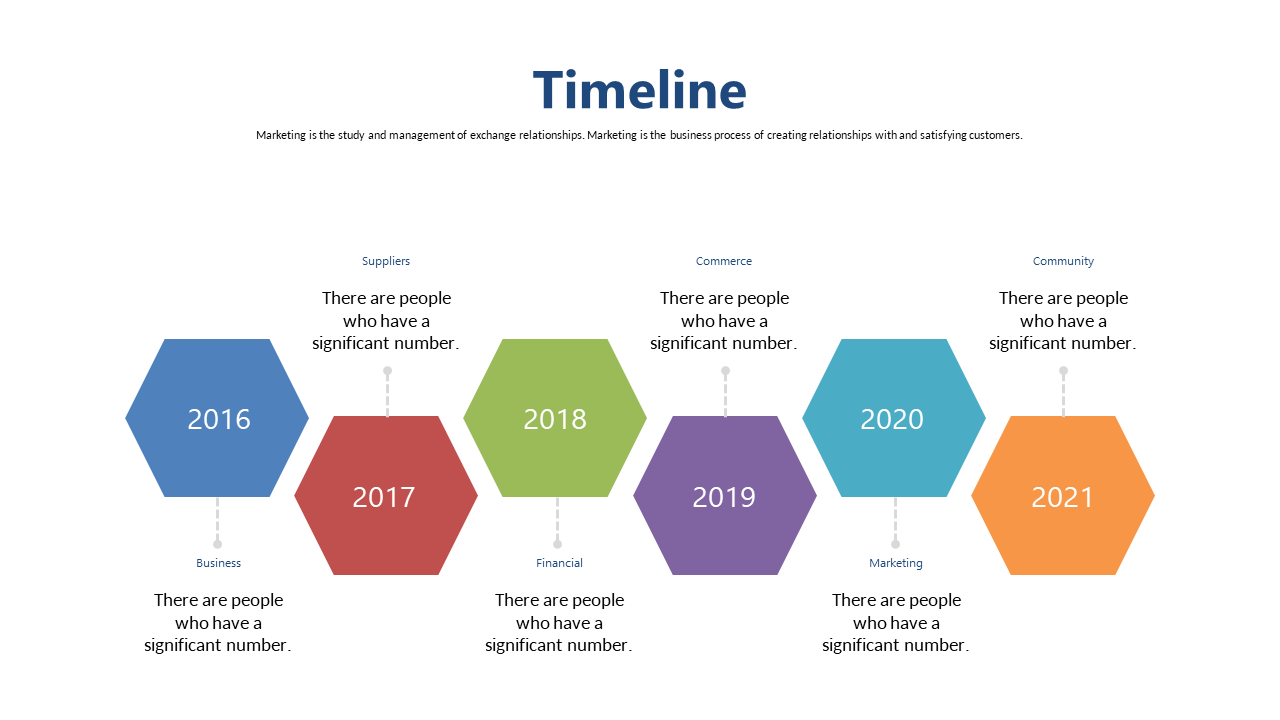
Project management can feel like navigating a labyrinth, especially when you need to illustrate the stages of a project’s life cycle. Miscommunication or unclear visuals can lead to confusion among team members. This slide provides a clean, hexagonal design that clearly communicates each stage, helping everyone stay on the same page.
Project managers in IT, construction, or marketing teams can benefit from this layout during project kick-off meetings or status updates. Whether you’re a project coordinator presenting to your team or a program manager briefing executives, this slide makes it easier to illustrate progress and expectations across different phases.
At just $0.99, you can download this slide instantly and edit it to fit your specific project needs. It’s compatible with both PowerPoint and Google Slides, so
you can customize it in minutes and elevate your presentations.
$0.99 – Purchase Checkout
Added to cart