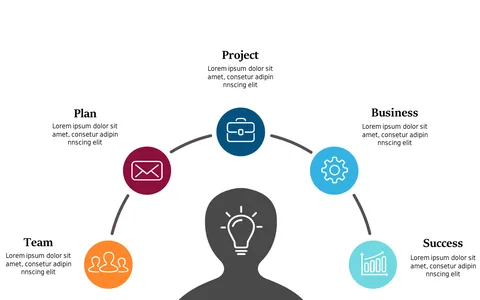
Circular Layout for Project Life Cycle Visualization

Product Description
Presenting the project life cycle in a way that resonates with your audience can often feel like an uphill battle. Complicated processes can lead to confusion, leaving your team or stakeholders unsure about what comes next.
This slide provides a circular layout that not only simplifies the presentation but also visually engages your audience with each stage of the project life cycle from initiation to closure. Whether you’re an operations manager leading a project review or a product manager presenting updates to your executive team, this slide will serve you well. Its design suits any industry, whether you’re in healthcare, software development, or logistics, making complex processes easier to grasp during meetings or strategic planning sessions.
You’ll be pleased to know that for just $0.99, this slide is an instant download, fully editable in PowerPoint and Google Slides. Customize it in no time to match your project needs, ensuring you’re ready to present clearly and effectively.
$0.99 – Purchase Checkout
Added to cart