Gantt Chart for Key Activities in Projects
Product Description
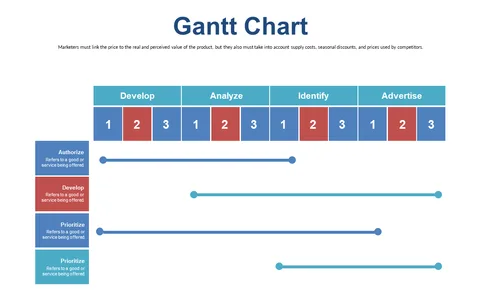
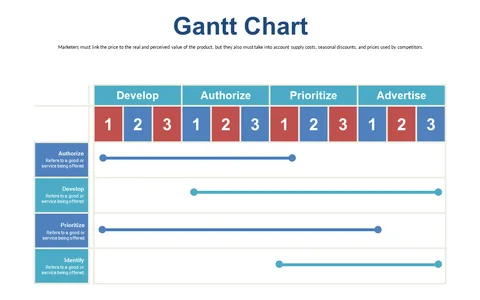
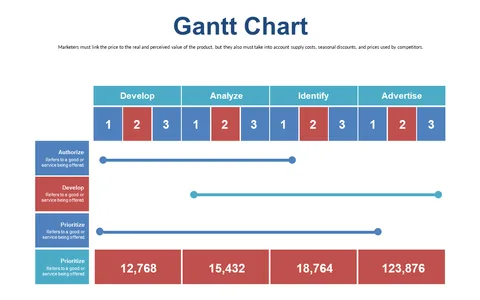
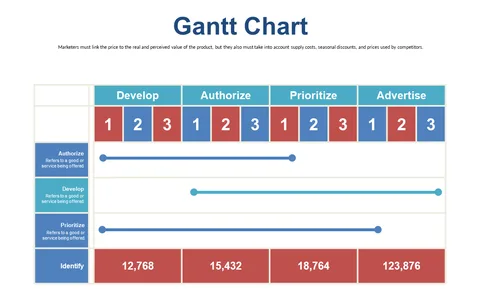
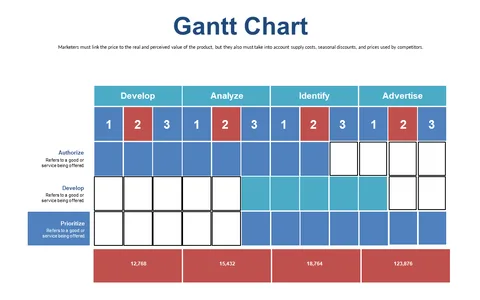
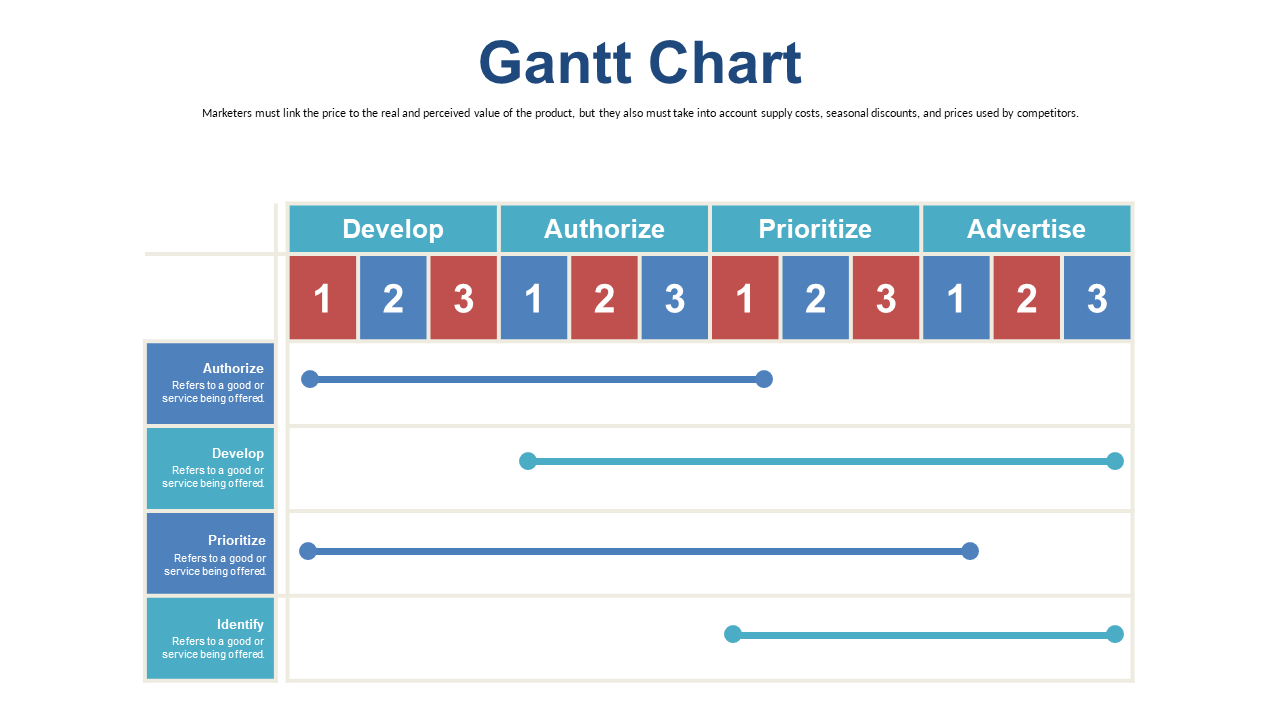
Navigating the complexities of project timelines and multiple tasks can be a real headache. This Gantt Chart slide provides a clear visual overview of key activities throughout various phases of your projects, making it easy to communicate timelines and responsibilities effectively.
This slide is a great fit for project coordinators in IT during software development meetings or for marketing teams tackling product rollout campaigns. If you’re frequently updating team members on project status or discussing shifts in timelines, this visual aid will help keep everyone on the same page.
Available for just $0.99, you can download this customizable slide instantly and edit it using PowerPoint or Google Slides. It’s designed to help you streamline your project communications in just minutes.
$0.99 – Purchase Checkout
Added to cart