Gantt Chart for Multi-Phase Project Management
Product Description
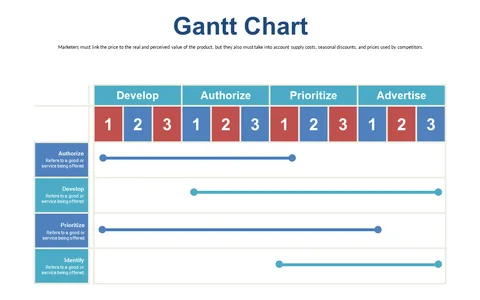
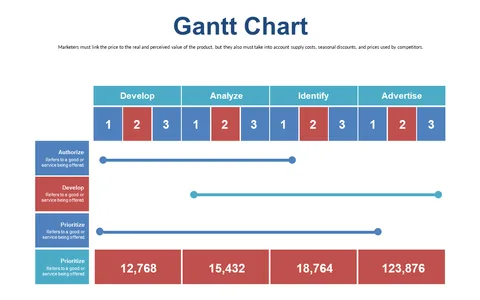
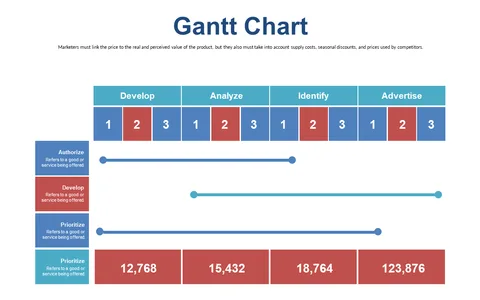
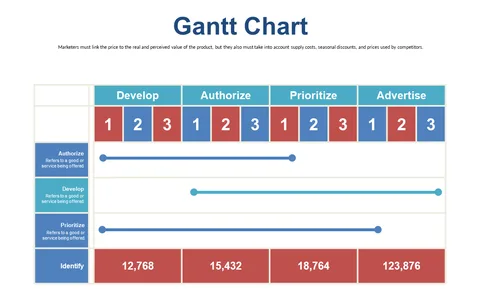
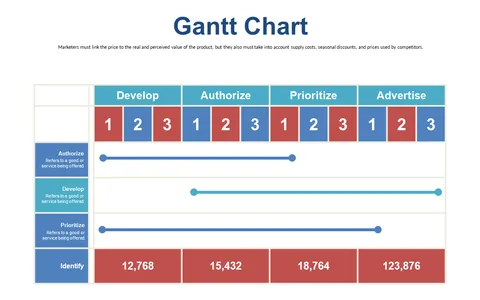
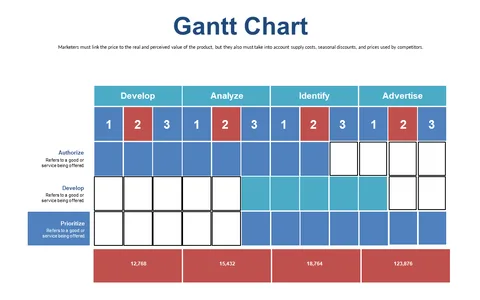
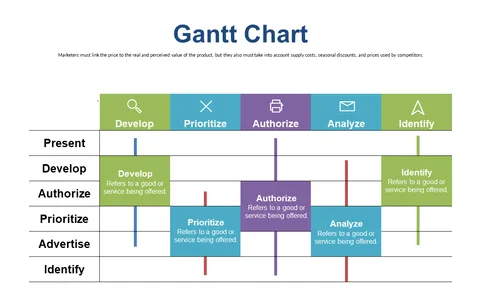
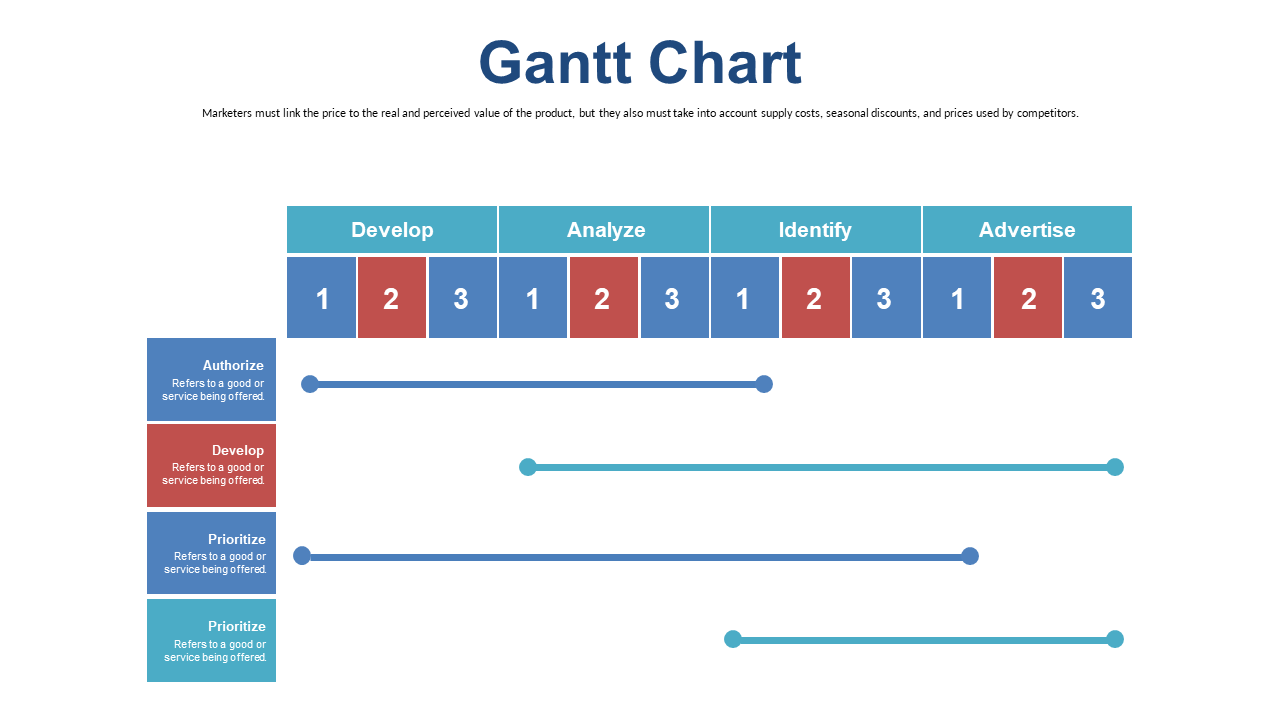
Keeping track of timelines and responsibilities in a multi-phase project can often lead to stress and miscommunication. This Gantt chart slide simplifies the process by providing a clear visual representation of key activities across different phases, allowing you to quickly assess progress.
You might find this slide particularly useful as a construction project manager overseeing multiple contractors, or as a product development lead organizing tasks for various teams. It’s perfect for any meetings where you need to ensure that everyone understands their roles and deadlines.
At a price of only $0.99, this slide is available for an instant download and can be easily edited in both PowerPoint and Google Slides. Customize it to suit your specific project needs and enhance your management efficiency in just minutes.
$0.99 – Purchase Checkout
Added to cart