Gantt Chart for Service Metrics Assessment
Product Description
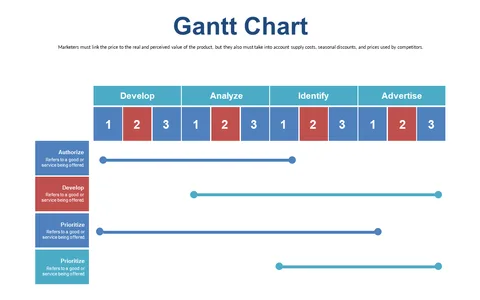
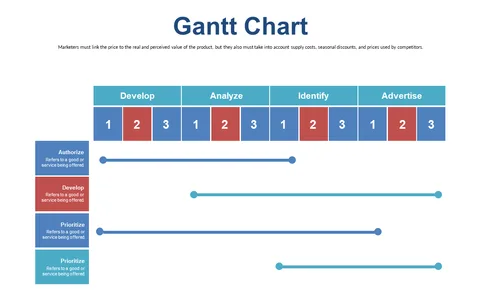
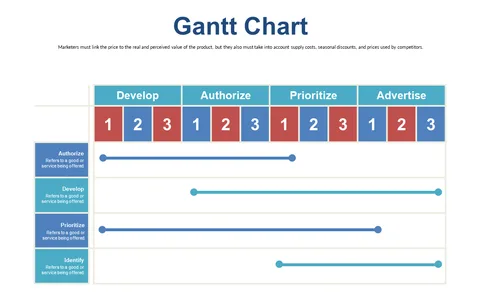
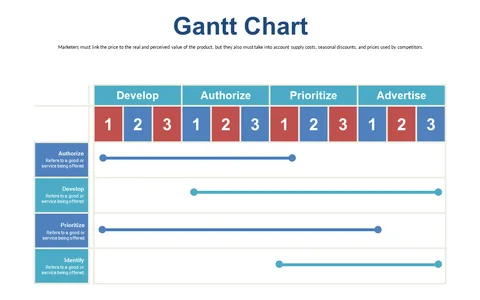
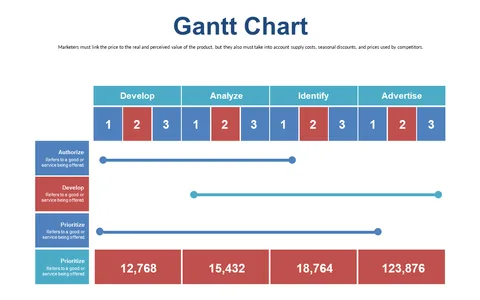
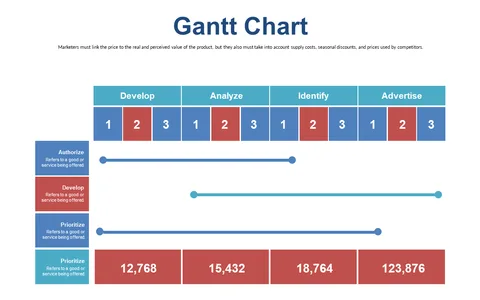
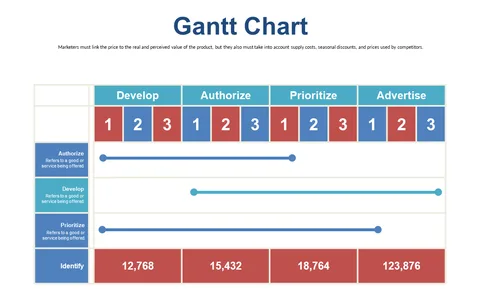
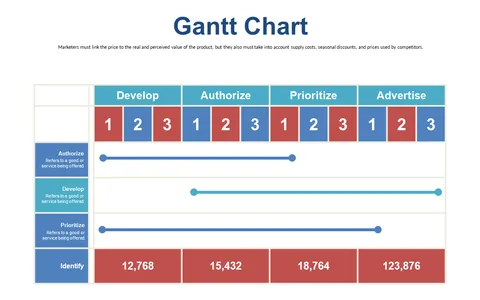
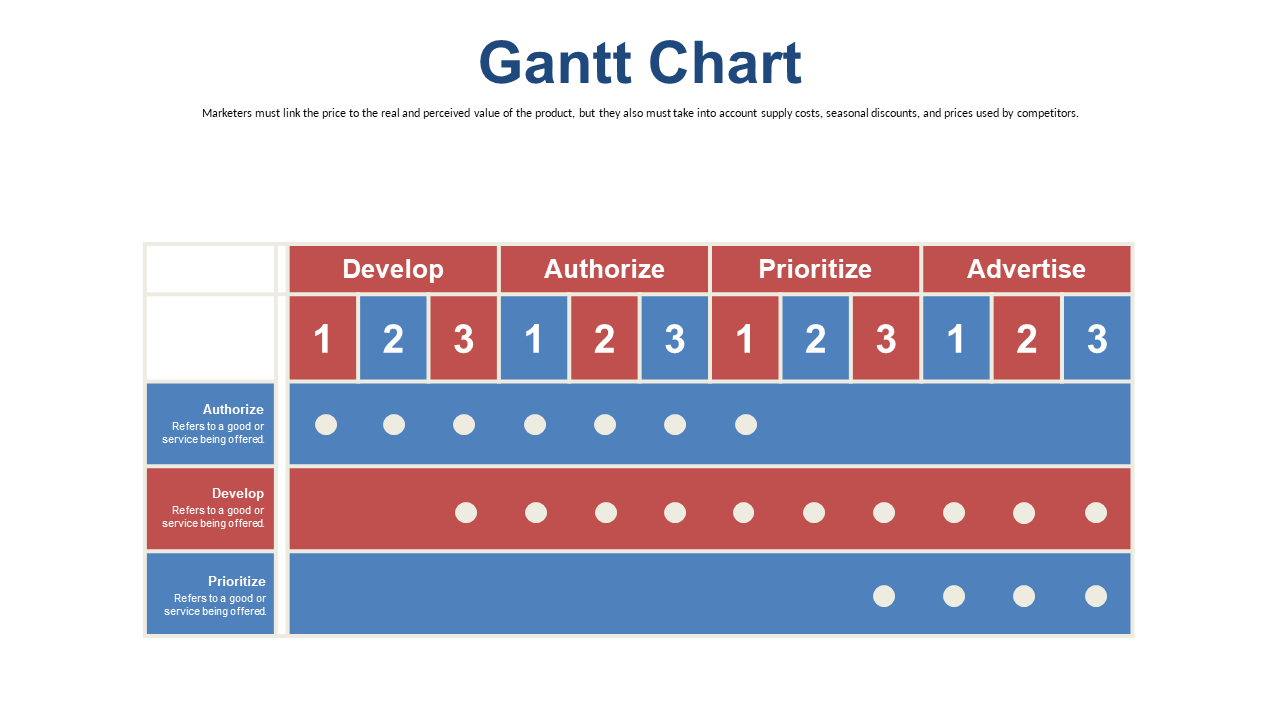
Keeping track of metrics and timelines while managing multiple services can feel like a daunting task. This Gantt Chart slide provides a straightforward visual representation that allows you to assess and compare various service performance metrics effectively.
It’s all about making complex information easier to absorb and understand. Consider using this slide as a marketing manager reviewing different campaigns, or as an operations lead coordinating service deliveries across teams. It fits perfectly into meetings where you need to present updates on service performance or discuss adjustments required to meet your goals.
Available for only $0.99, this slide is ready for instant download and can be easily edited in PowerPoint and Google Slides. Customize it to your liking, and enhance your service assessments in no time.
$0.99 – Purchase Checkout
Added to cart