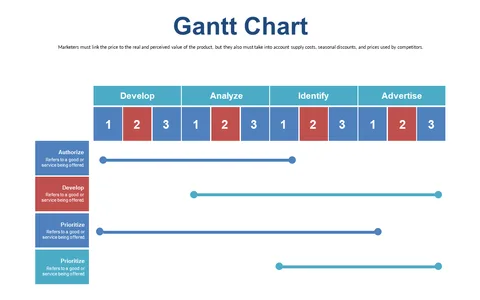
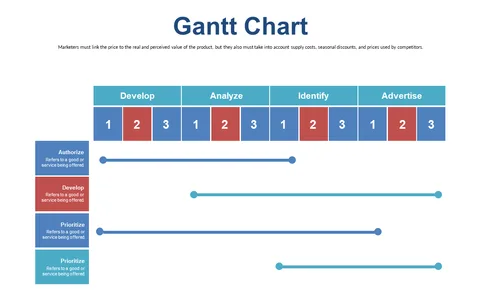
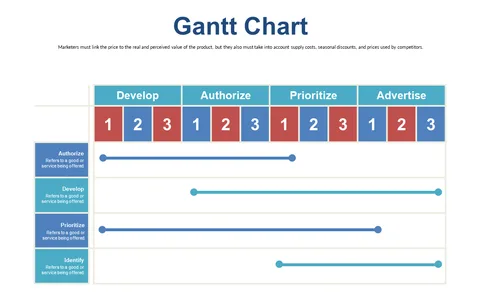
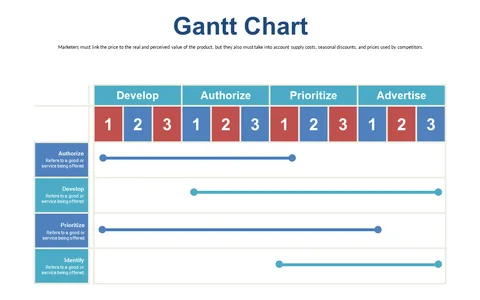
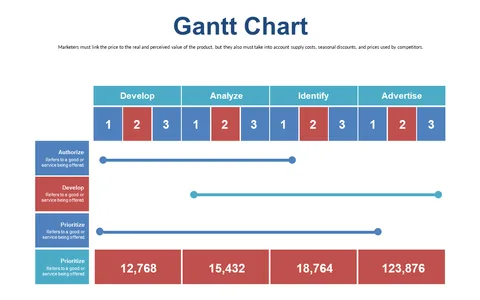
Gantt Chart for Comprehensive Service Evaluation
Product Description
Evaluating services can often feel like trying to juggle too many balls at once. Keeping track of multiple tasks and their performance over time can lead to confusion and a lack of clarity.
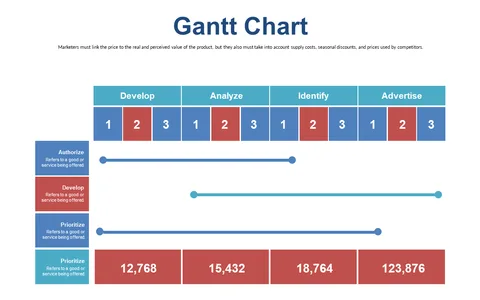
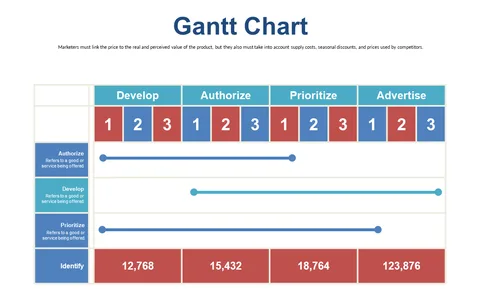
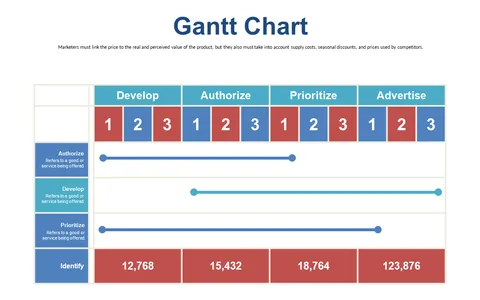
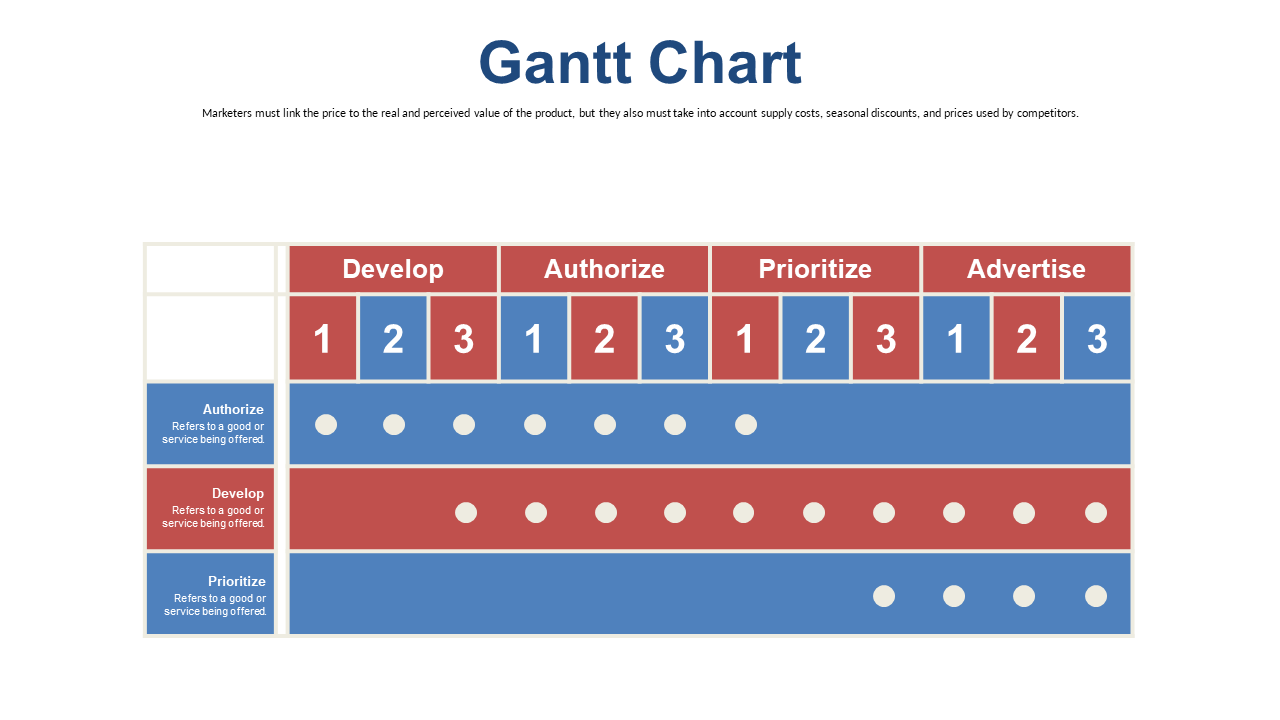
This Gantt Chart slide offers a structured way to visualize your service metrics, making it easier to see where things stand at a glance. This slide is perfect for business analysts, project managers, or service coordinators conducting service evaluations. Whether you’re in healthcare assessing patient services or in marketing reviewing campaign performance, this clear visual representation helps you easily communicate progress and areas for improvement during team meetings.
At just $0.99, you can download this slide instantly and edit it directly in PowerPoint or Google Slides. Customize it to fit your specific needs and start simplifying your service evaluations in minutes.
$0.99 – Purchase Checkout
Added to cart