Visualize Team Roles with Hierarchical Org Chart

Product Description
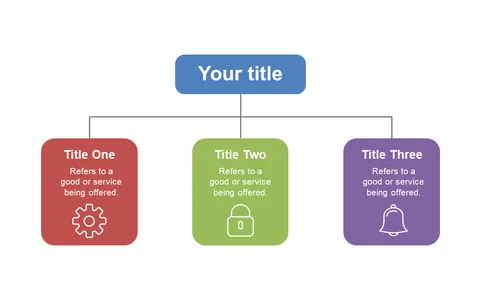
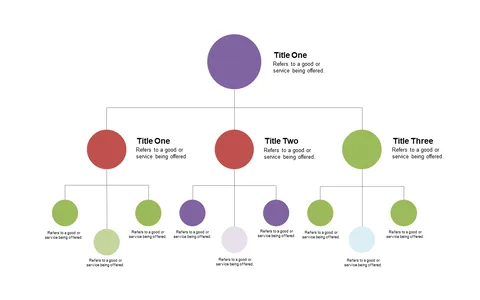
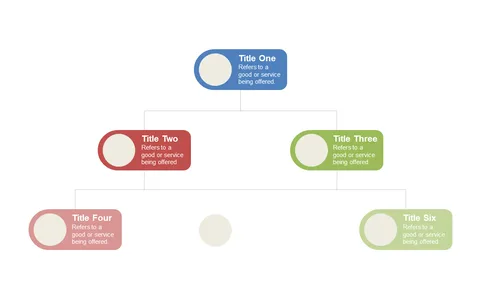
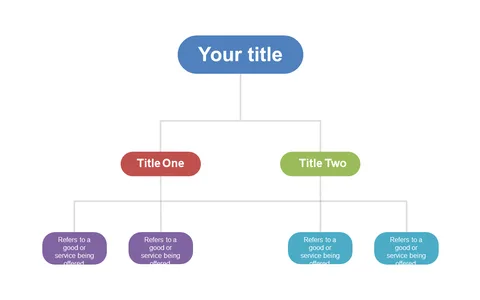
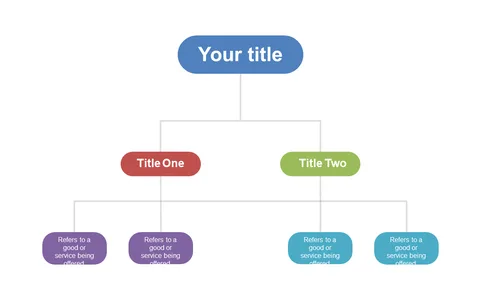
When team dynamics are hard to grasp, a visual representation can bridge that gap. This hierarchical org chart slide helps you present roles clearly, using color-coded boxes to differentiate functions and reporting lines.
It takes the guesswork out of understanding team structures, leading to better collaboration. Use this slide in discussions with department managers looking to clarify team roles, or during training sessions for new employees to illustrate team dynamics. It’s also great for strategic planning meetings where you need to discuss service offerings and the people behind them.
For just $0.99, you can download this slide and customize it to meet your needs immediately. Available in PowerPoint and Google Slides, it’s a quick solution to illustrate your team’s structure effectively.
$0.99 – Purchase Checkout
Added to cart