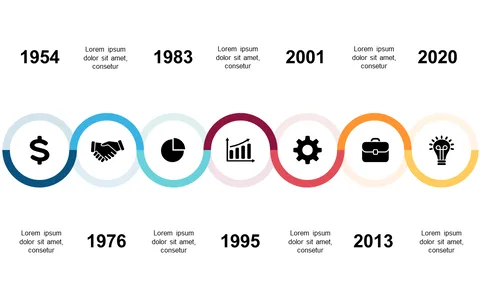
Visualize Project Milestones with Timeline and Callouts

Product Description
Keeping your team informed about project milestones can feel like herding cats. Without a clear visual presentation, important dates and achievements might get lost in discussion, causing confusion and misalignment.
This slide offers an effective way to visualize timelines with engaging callouts that highlight every key moment. Product managers, project coordinators, and team leads will find this slide invaluable when presenting timelines during project kick-offs or status updates. Whether you’re laying out quarterly goals or tracking deliverables, this layout makes it easy for anyone to grasp the trajectory of your project at a glance.
For just $0.99, you can download this slide instantly. It’s editable in both PowerPoint and Google Slides, allowing you to customize it to fit your specific project needs in minutes.
$0.99 – Purchase Checkout
Added to cart