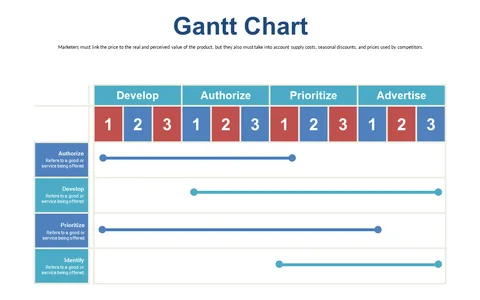
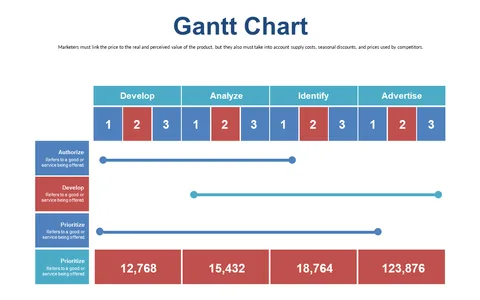
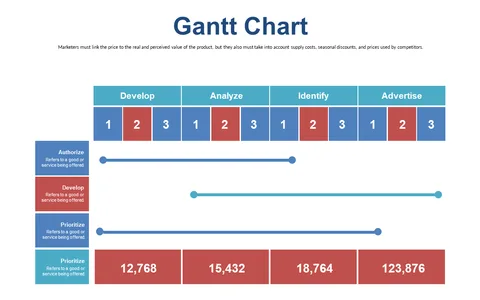
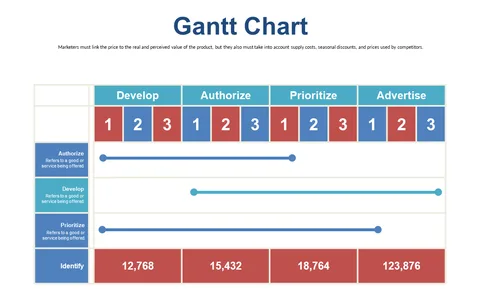
Gantt Chart for Project Phases Tracking
Product Description
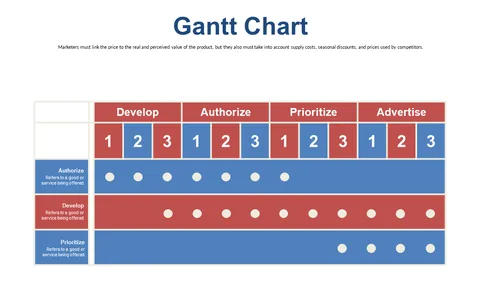
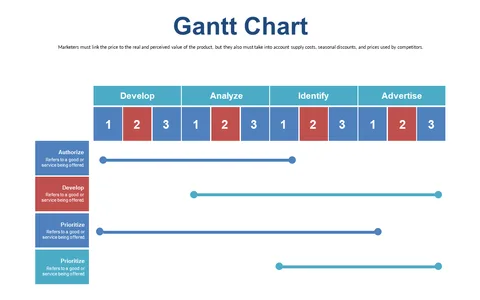
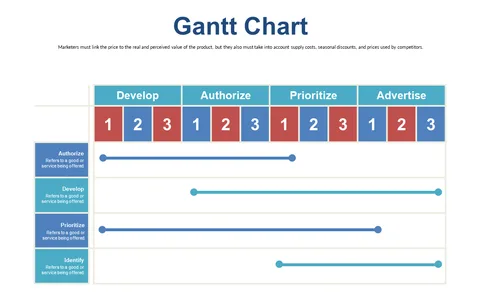
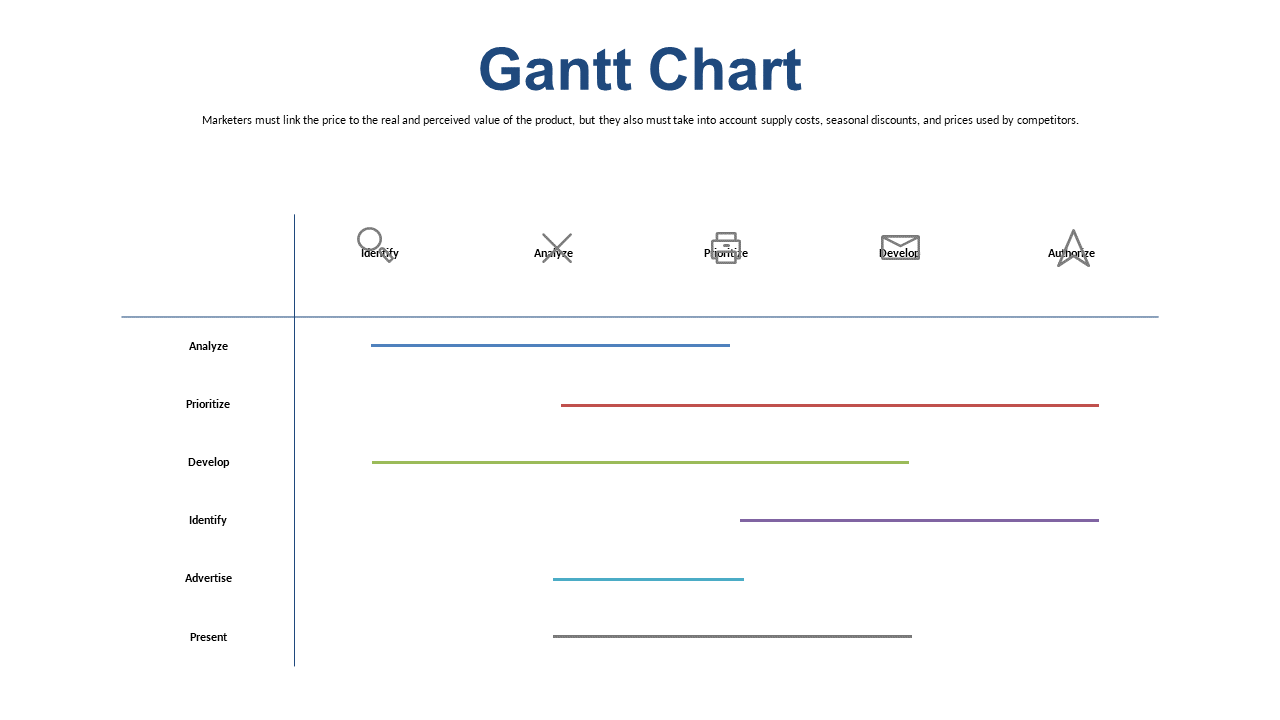
Managing multiple project phases and deadlines often leads to confusion among team members. With this Gantt Chart slide, you can provide a visual roadmap that clarifies where your team stands and what needs to happen next.
This kind of layout takes the guesswork out of your project management discussions. Project coordinators and team leads in advertising or construction will find this slide invaluable during team meetings or client briefings. It’s the perfect tool for anyone who needs to communicate progress quickly and effectively, ensuring that everyone is on the same page.
At just $0.99, this Gantt Chart slide is an easy addition to your presentation toolkit. Download it now, and it’s ready to be edited in PowerPoint and Google Slides, allowing for fast customization to meet your project needs.
$0.99 – Purchase Checkout
Added to cart