Monitor Project Milestones Using Gantt Chart
Product Description
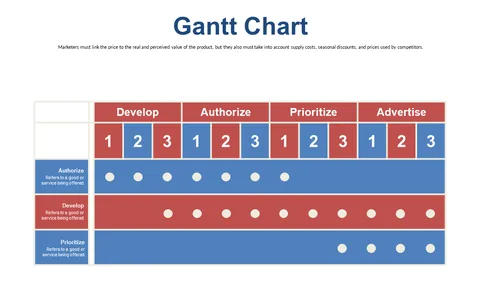
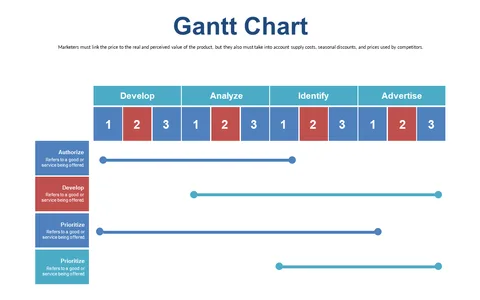
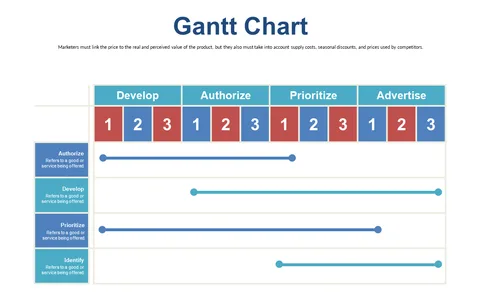
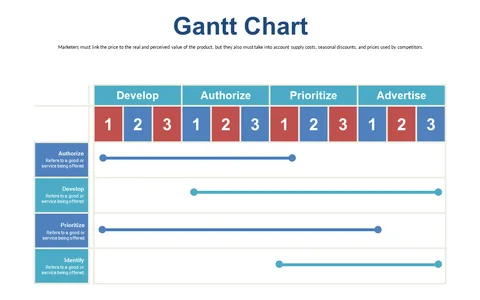
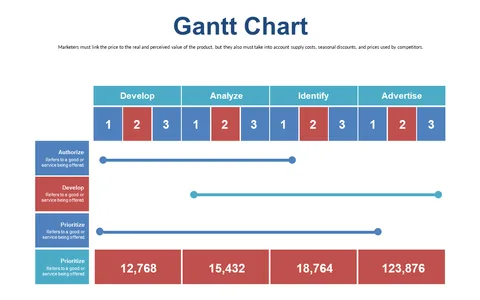
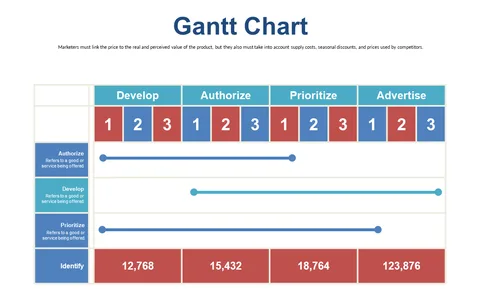
Keeping track of multiple project milestones can feel chaotic, especially when you’re trying to communicate progress to your team or clients. A visual representation makes it easier for everyone to understand where things stand and what’s coming next.
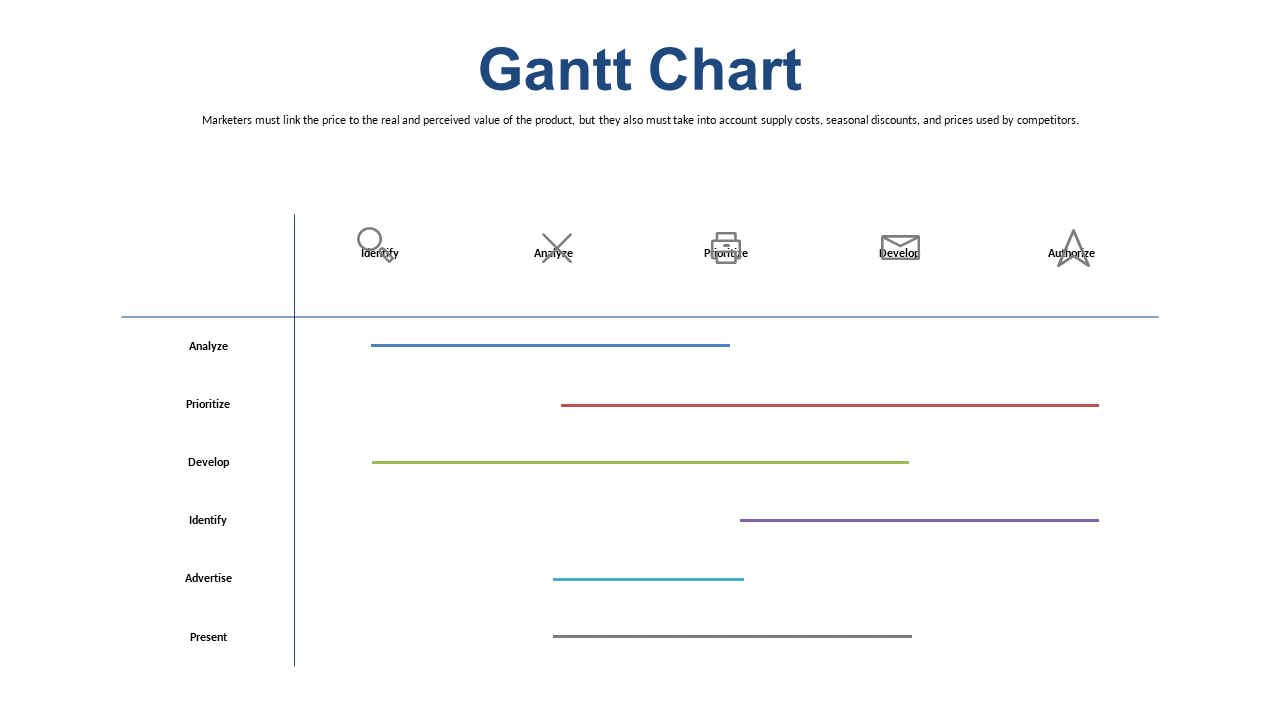
With this Gantt Chart slide, you can transform your project updates into clear and concise timelines. Project managers in IT or construction industries will find this slide particularly useful during progress meetings or status updates. It’s perfect for showcasing phases in project kick-off meetings or quarterly reviews, helping everyone stay aligned on key deliverables and timelines.
For just $0.99, you can download this Gantt Chart slide and start customizing it in minutes. It’s ready for you in PowerPoint and Google Slides, making it easy to edit and adapt to your specific project needs.
$0.99 – Purchase Checkout
Added to cart