Visualize Service Development Phases with Gantt Chart
Product Description
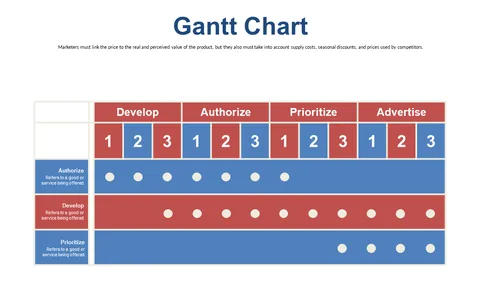
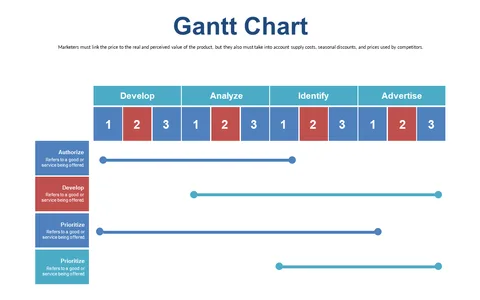
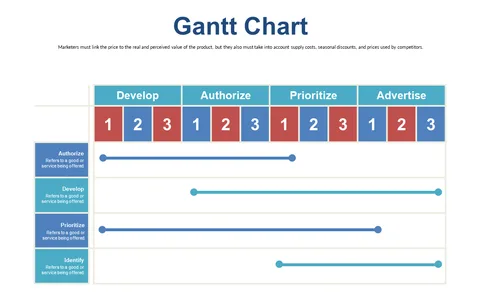
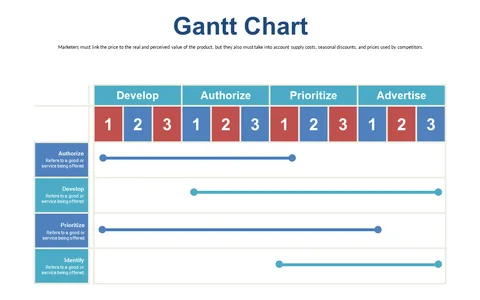
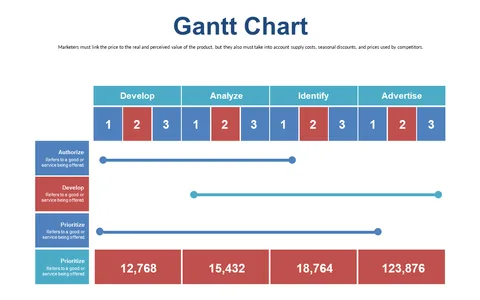
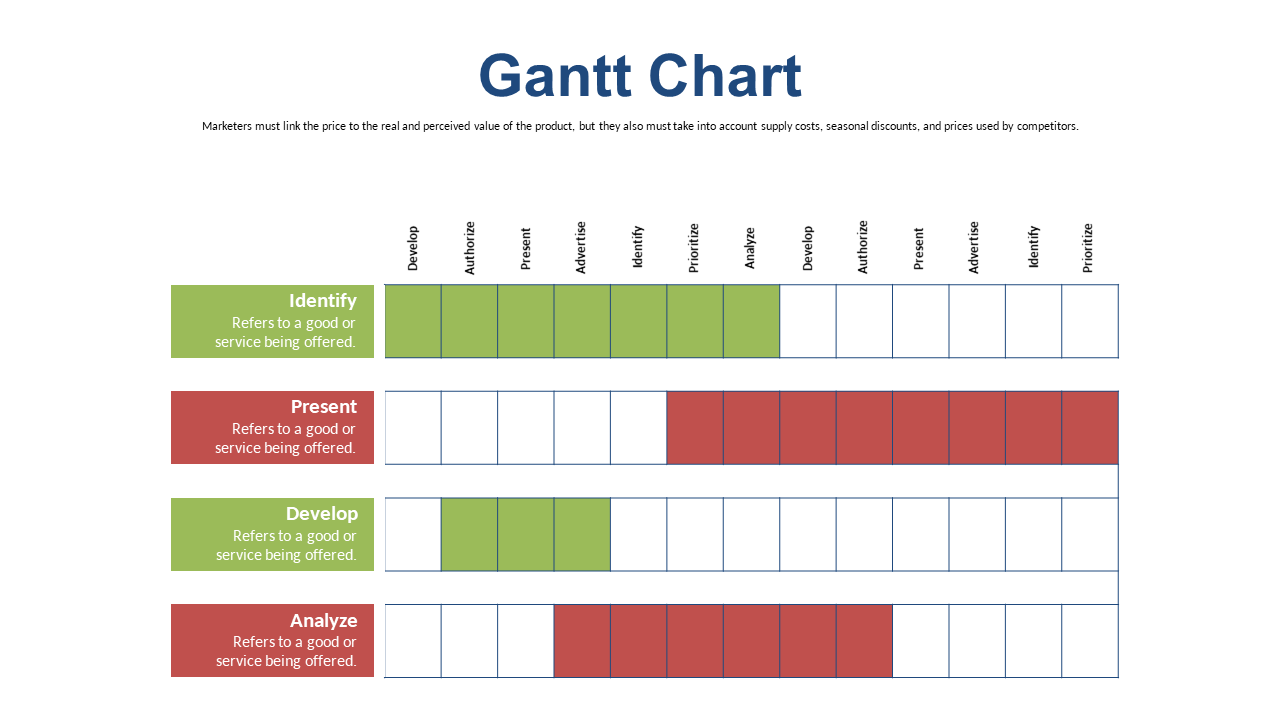
Service development often feels chaotic, especially when multiple phases overlap and timelines shift unexpectedly. This Gantt chart slide provides a concise visual overview of your development process, helping teams grasp where they stand in real-time and what’s on the horizon. With this tool, you can enhance clarity and focus across your projects.
Project coordinators, service designers, and team leads in various fields will find this slide incredibly effective for managing service development. It’s perfect for cross-functional meetings, where keeping everyone on the same page is crucial. Use this Gantt chart to visualize your project phases and ensure timely delivery.
Available for only $0.99, this Gantt Chart slide is ready for immediate download. You can edit it in both PowerPoint and Google Slides, allowing you to tailor it to your service projects in no time. Get started on organizing your service development processes today!
$0.99 – Purchase Checkout
Added to cart