Monitor Task Progression with Gantt Chart
Product Description
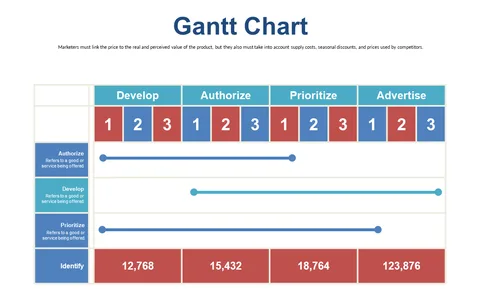
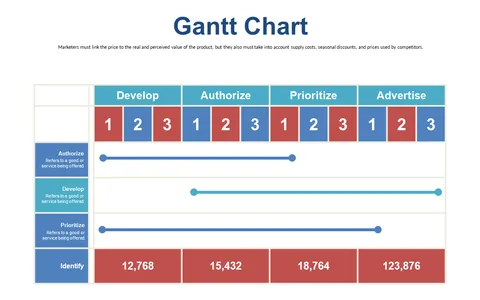
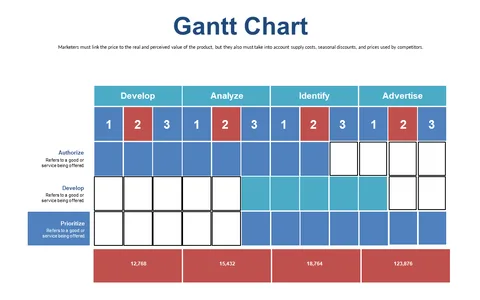
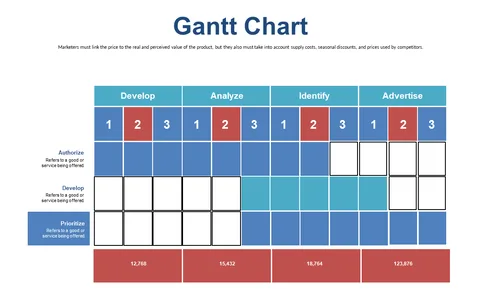
Staying on top of multiple tasks can be a real headache, especially when projects overlap with tight deadlines. You need a visual way to keep everyone aligned on the status of various tasks.
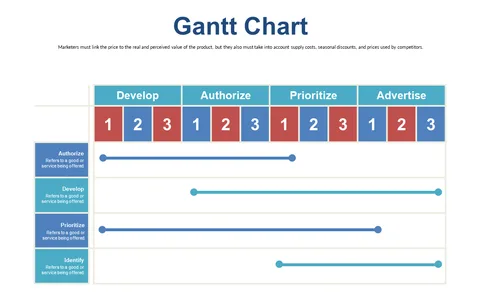
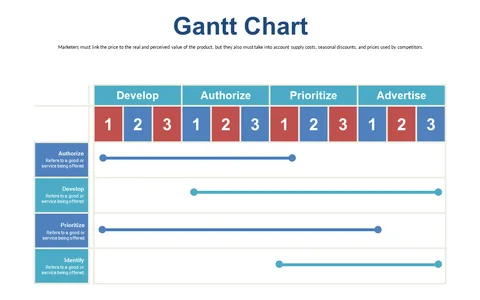
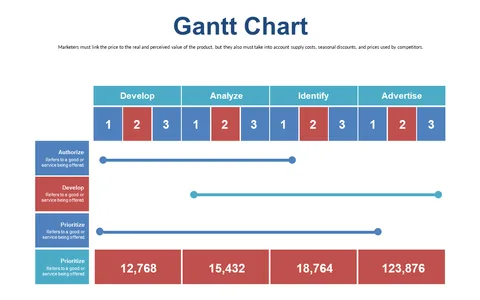
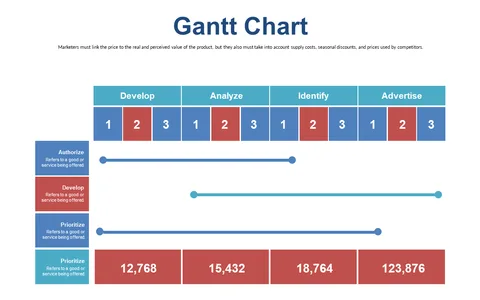
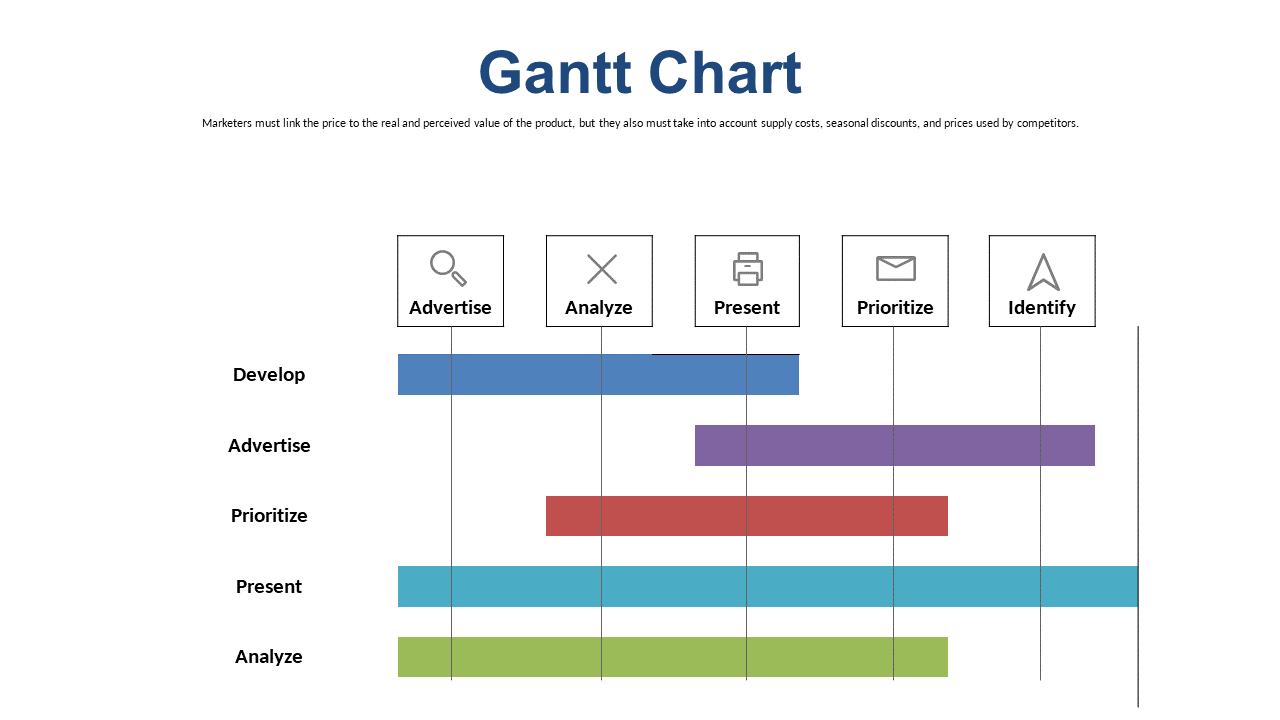
This Gantt chart slide makes it easy to track progression and clearly display priorities on a timeline. This slide is an excellent choice for delivery leads in tech startups or marketing agencies, particularly useful during project status meetings or team check-ins. If you’re a business analyst or project supervisor managing concurrent projects, this tool will keep your stakeholders informed without overwhelming them with details.
Available for just $0.99, this slide is ready for instant download and can be easily edited in PowerPoint or Google Slides. Spend less time on formatting and more time delivering updates with this user-friendly option.
$0.99 – Purchase Checkout
Added to cart