Visualize Market Data with Europe Map and Percentage Overlay
Product Description
Navigating complex data can be a significant challenge, particularly when you need to convey market insights clearly. Finding a way to illustrate these insights without losing your audience’s attention is essential.
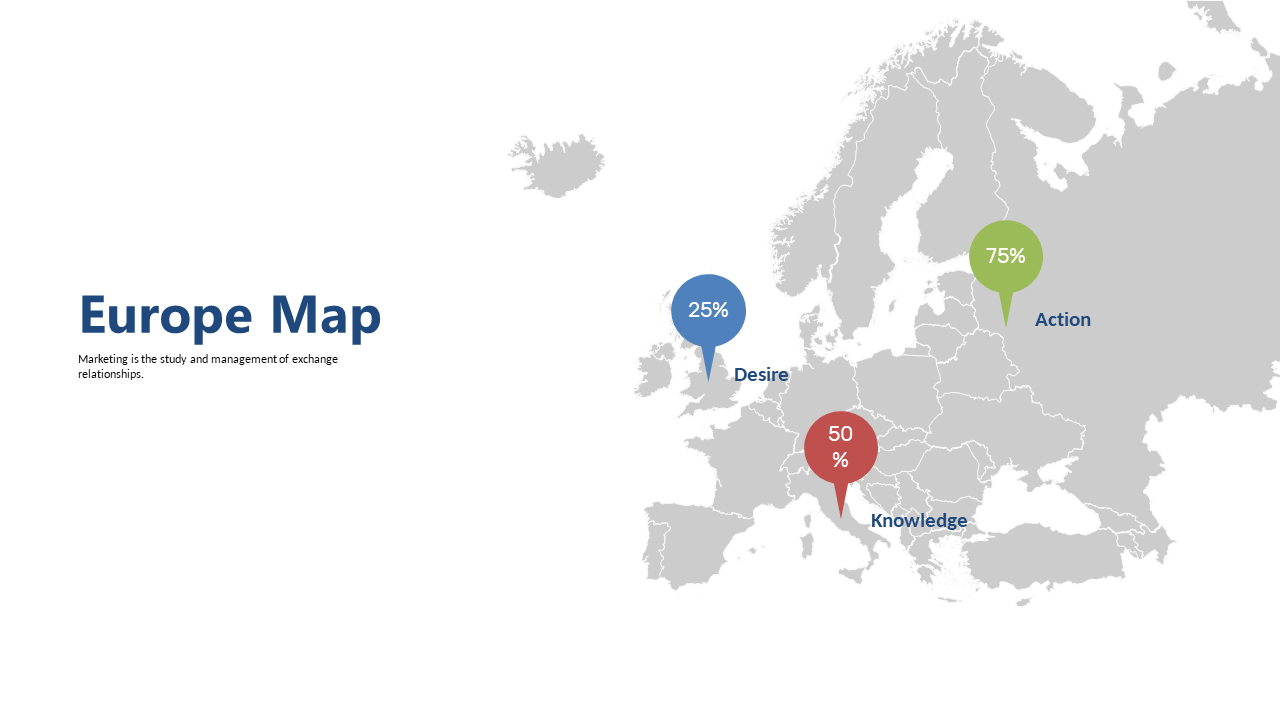
This slide features a detailed map of Europe, skillfully overlaid with percentage metrics that highlight key statistics, enabling you to present vital data points effectively. Business analysts and market researchers will find this slide perfect for presentations focused on market trends or competitive analysis. Whether you’re discussing growth opportunities or regional performance metrics, the visual clarity of this map will enhance the impact of your findings.
For just $0.99, you can download this slide instantly and make it your own. It’s fully editable in PowerPoint and Google Slides, so you’ll be ready to present your insights in a matter of minutes.
$0.99 – Purchase Checkout
Added to cart







