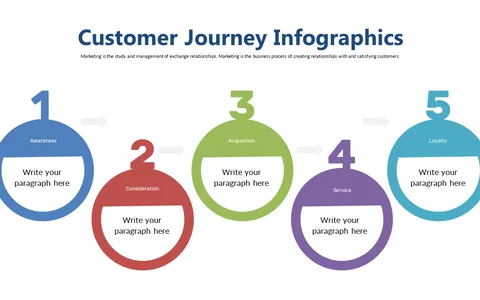
Customer Journey Infographic with Circular Steps
Product Description
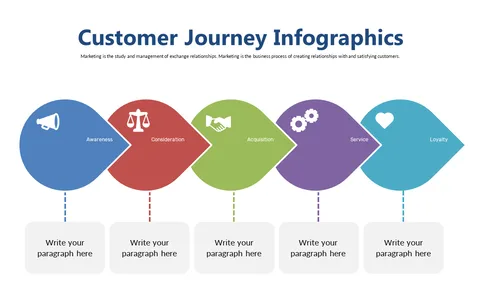
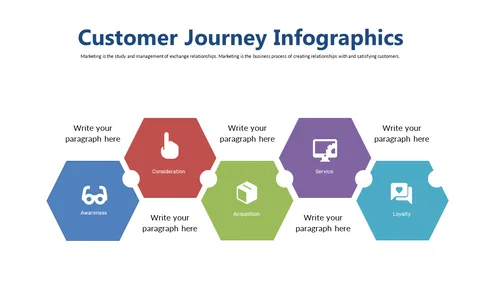
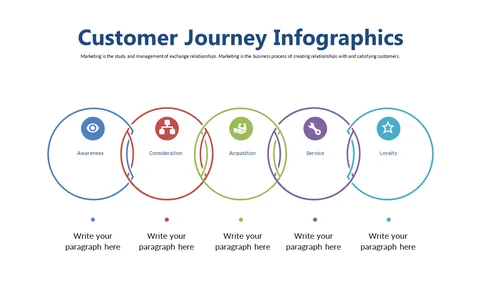
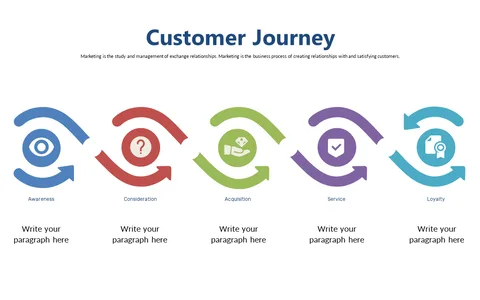
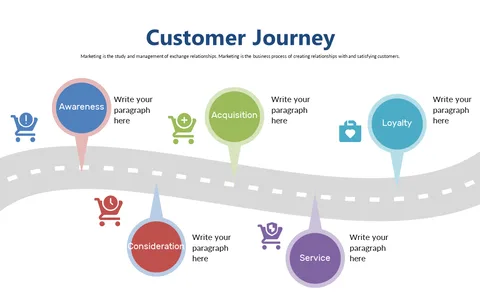
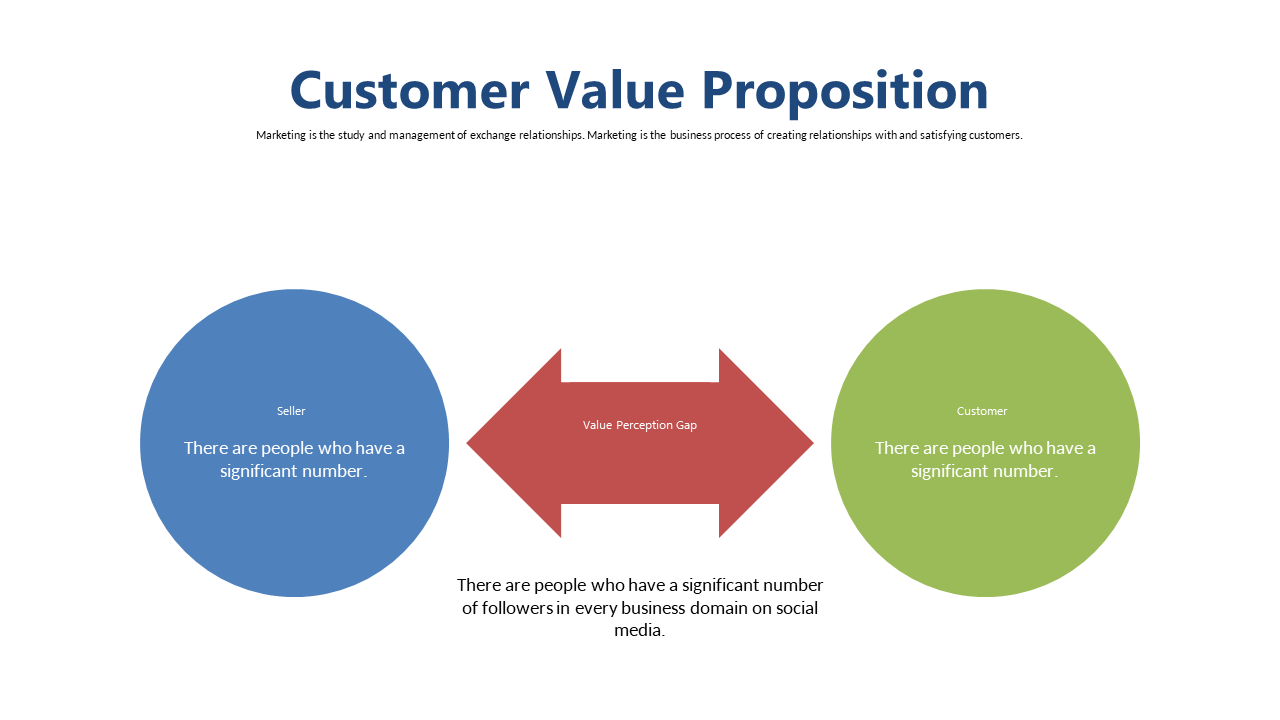
Understanding the customer journey can feel overwhelming, especially when you’re trying to visualize complex steps and interconnections. This infographic slide simplifies that challenge, presenting the circular steps of the customer journey in a clear, engaging manner that highlights the dynamic relationship between you and your customers.
Marketing managers and customer experience professionals will find this slide invaluable during strategy sessions or team presentations. It’s perfect for illustrating customer feedback loops, onboarding processes, or even as part of a comprehensive customer satisfaction report, allowing your audience to grasp the journey at a glance.
For just $0.99, you can download this slide and start making your presentations more engaging right away. It’s fully editable in both PowerPoint and Google Slides, so
you can customize it to fit your specific needs in just minutes.
$0.99 – Purchase Checkout
Added to cart