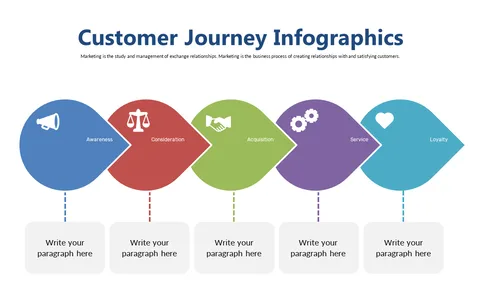
Arrows Connecting Customer Journey Stages
Product Description
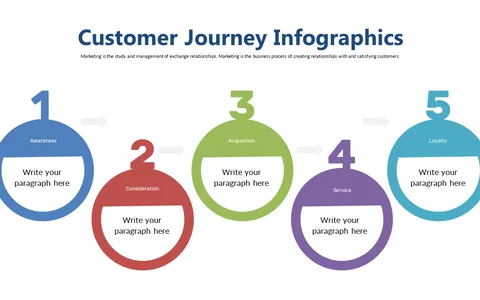
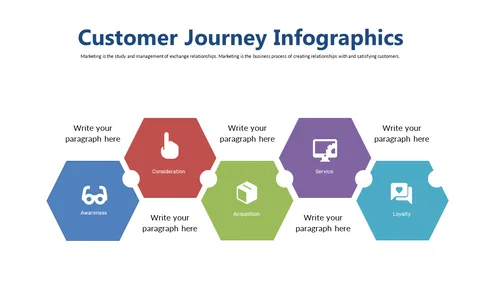
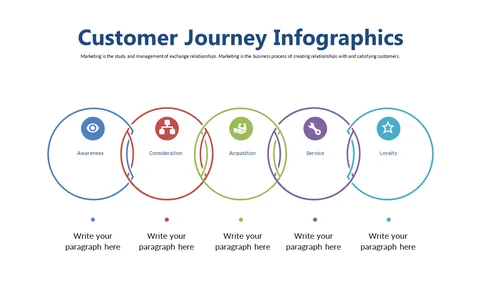
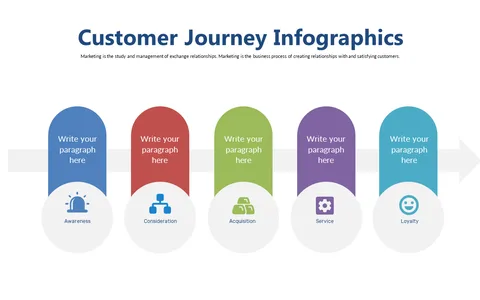
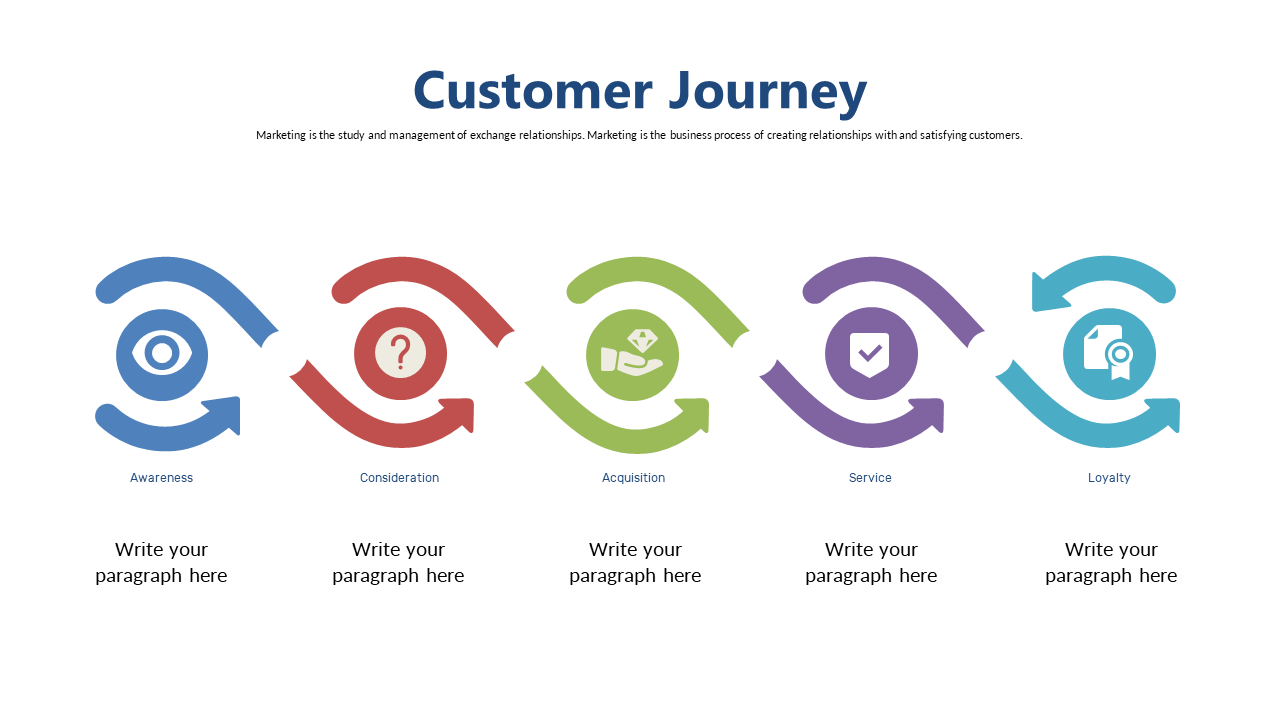
Visualizing the connections between various customer journey stages can be tough, especially when you want to showcase interactions clearly. This slide employs arrows to link key stages, making the flow of the customer experience easy to follow and understand.
Sales teams, customer experience professionals, and project leaders will find this slide invaluable during strategy discussions, project kick-offs, or team alignment meetings. It’s perfect for mapping out customer interactions and facilitating conversations about improving outcomes.
Download this slide for just $0.99, and you’ll have it ready in no time. It’s fully editable in PowerPoint and Google Slides, so
you can customize it effortlessly to match your presentation style.
$0.99 – Purchase Checkout
Added to cart