Engaging Customer Journey Infographic with Arrows

Product Description
Navigating the intricacies of the customer journey can be challenging, especially when you need to communicate it effectively to a team. Without an engaging visual, important details about user experience might be overlooked.
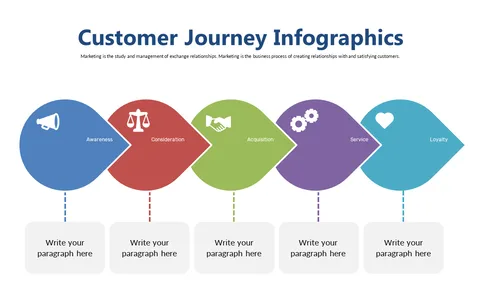
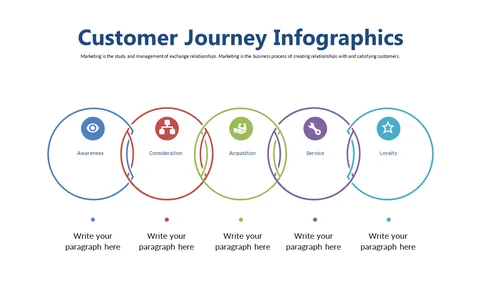
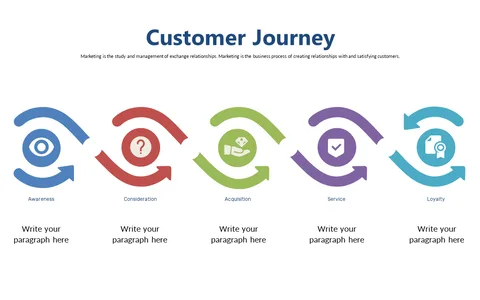
This infographic slide, featuring colorful arrows, clearly illustrates the stages of the customer journey to keep everyone on the same page. This is especially beneficial for user experience designers, customer success managers, and marketing professionals. You can utilize it during workshops, strategy meetings, or client presentations to demonstrate how prospects progress through their journey, whether in sectors like e-commerce, SaaS, or service industries.
For just $0.99, this slide is available for immediate download and can be easily edited in PowerPoint or Google Slides. You’ll have the flexibility to make adjustments that reflect your brand’s unique narrative in just a matter of minutes.
$0.99 – Purchase Checkout
Added to cart