Compare Metrics with Triple Bar Chart Layout
Product Description
When presenting multiple metrics, confusion can arise if the data isn’t displayed clearly. You need a way to compare distinct figures that helps your audience grasp the information without getting lost in the details.
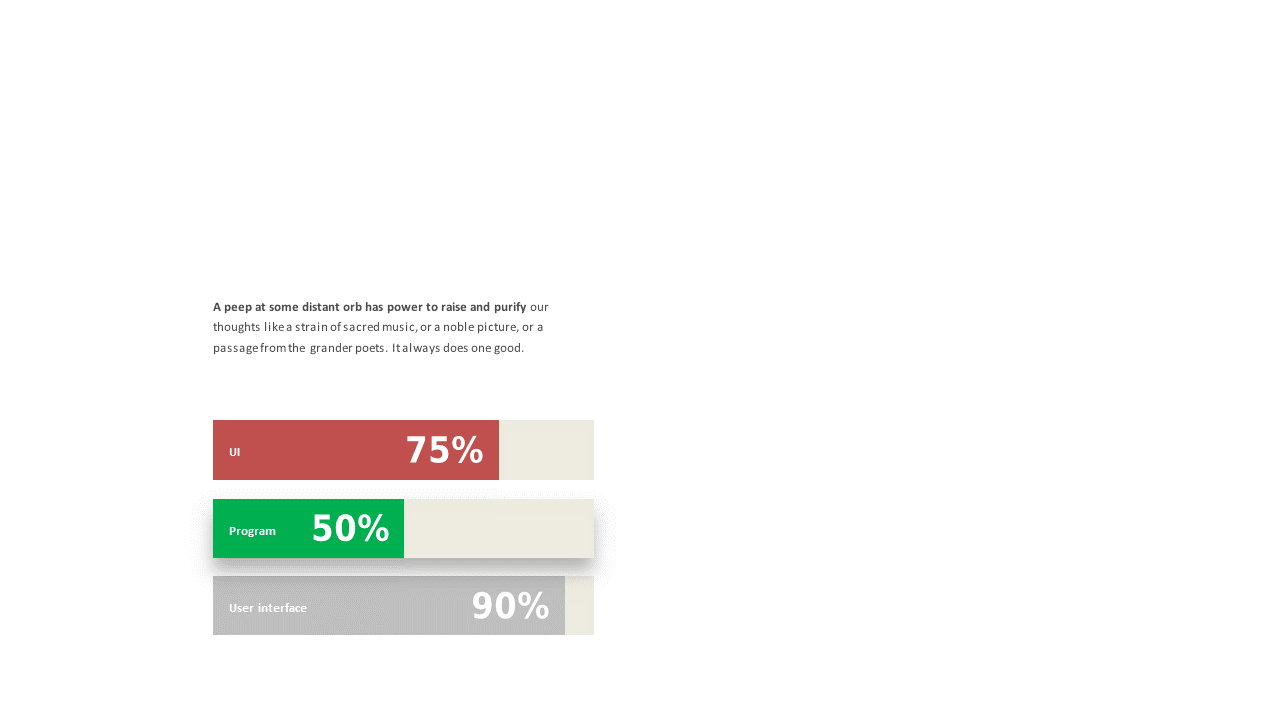
This triple bar chart layout simplifies that process, making it easy for viewers to see correlations and differences at a glance. Financial analysts preparing quarterly reports, marketing managers tracking campaign performance, and project leads evaluating team progress can all benefit from this slide. It’s perfect for board meetings, team reviews, or any situation where clear metrics comparison is essential.
For just $0.99, you can instantly download this slide and start editing right away in PowerPoint or Google Slides. It’s a simple yet effective solution that ensures your data is communicated clearly and professionally.
$0.99 – Purchase Checkout
Added to cart







