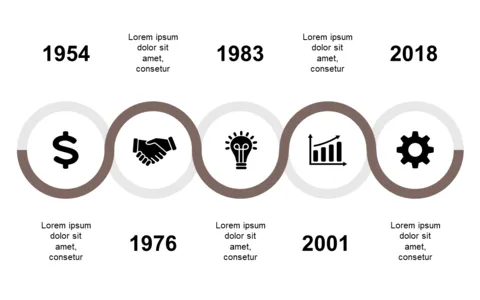
Showcase Milestones with Colorful Curved Timeline

Product Description
Conveying project timelines can often feel overwhelming, especially when you have critical milestones to showcase. If your timeline is complex, it can confuse rather than inform your audience.
A colorful curved timeline slide offers a visually dynamic way to highlight significant milestones, making your project updates more engaging. This slide is perfect for project managers discussing timelines in status meetings, marketing teams presenting campaign roadmaps, or anyone needing to report on strategic initiatives. You’ll find it invaluable in client meetings, internal reviews, or any situation where clarity is key.
For only $0.99, this slide is available for instant download and is easily editable in PowerPoint and Google Slides. You can tailor it to fit your project’s milestones and make a strong impression in no time.
$0.99 – Purchase Checkout
Added to cart