Present 5-Day Progress with Colored Bar Graph V2
Product Description
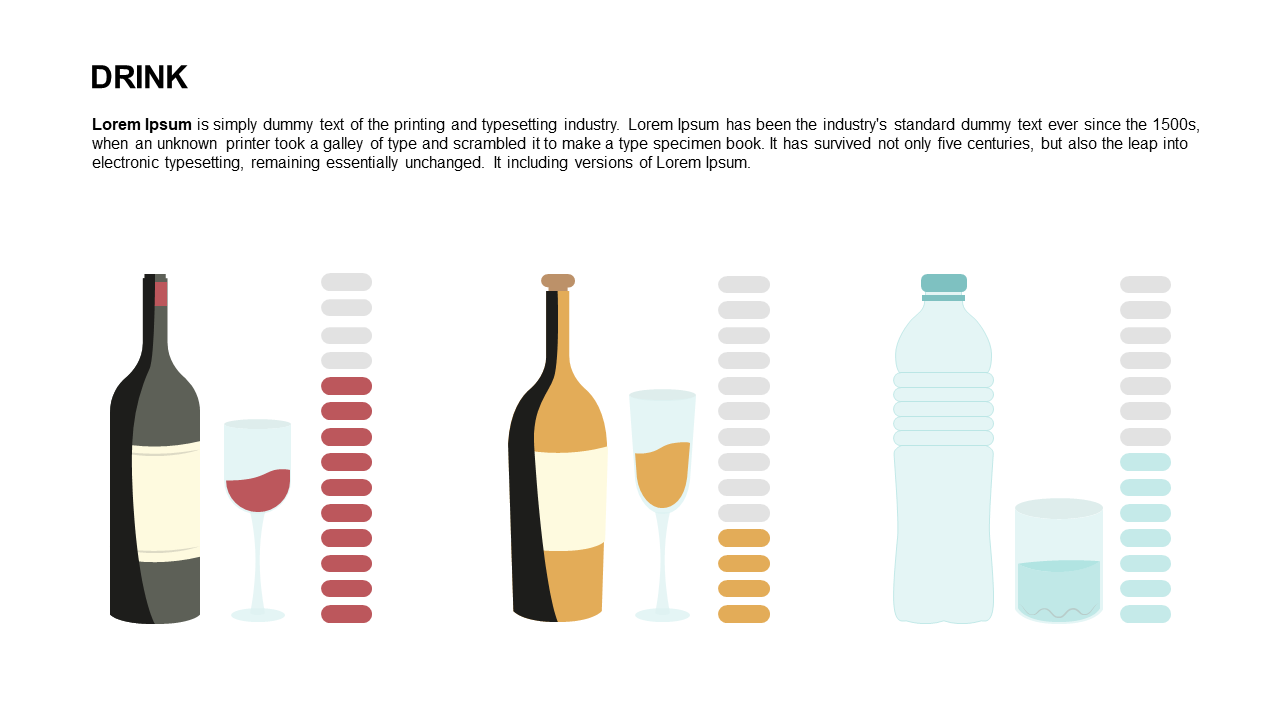
Conveying daily progress in your reports can be a daunting task, especially when the data seems dry and uninspiring. You want your audience to feel the impact of those numbers, but without the right visuals, they might lose interest. This slide offers a vibrant bar graph that captures five days of progress, making your data both engaging and meaningful.
Consider using this slide during weekly team meetings or project updates, where roles like project managers or sales leads need to present day-to-day achievements. It’s also perfect for operations teams tracking progress on various initiatives, giving everyone a clear view of how far you’ve come.
At just $0.99, this slide is an easy addition to your presentation toolkit. You can download it instantly, and it’s fully editable in both PowerPoint and Google Slides, so
you can customize it to fit your specific needs.
$0.99 – Purchase Checkout
Added to cart







