Showcase 5-Day Progress with Colored Bar Graph
Product Description
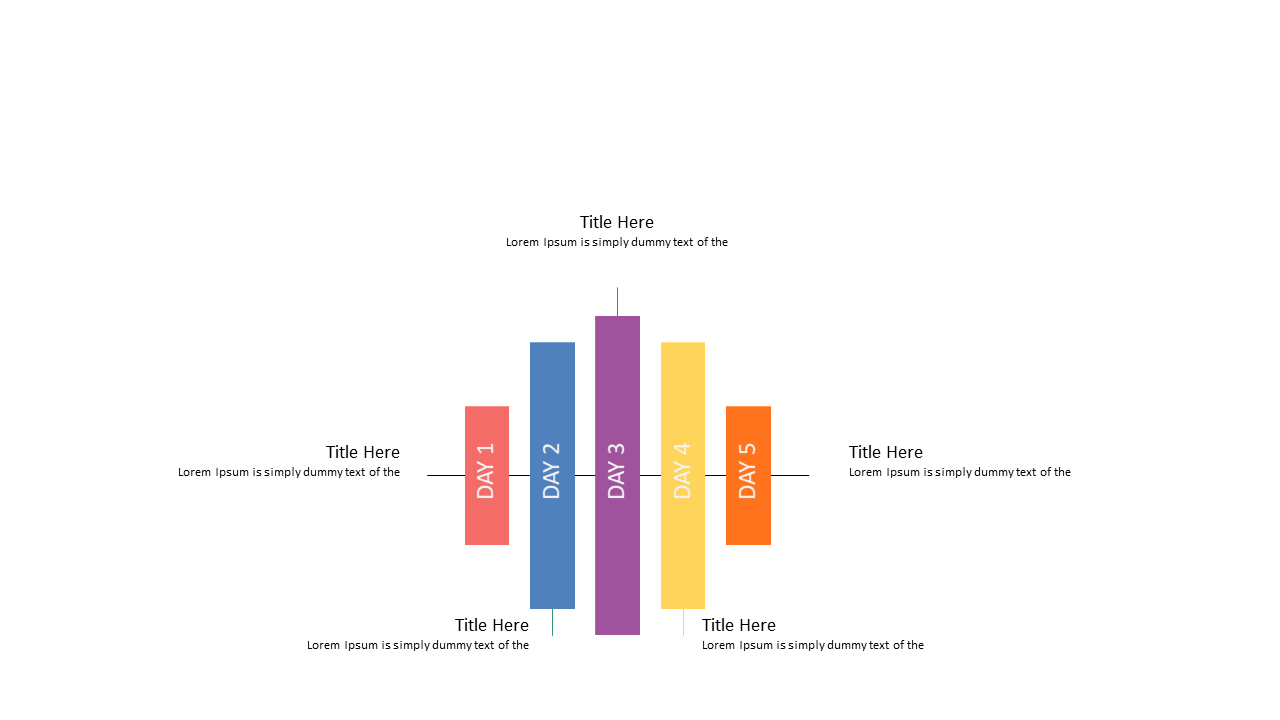
When you need to illustrate progress over time, communicating that data clearly is crucial. This colored bar graph makes it easy to present five days of progress in a vibrant and engaging way, allowing your audience to quickly spot trends.
It’s a fantastic tool for simplifying complex information into something visually appealing and digestible. Consider using this slide during daily stand-ups as a project manager, or when reporting on progress in a weekly team meeting for marketing efforts. It’s also ideal for sales teams who want to showcase their performance over a week, making it invaluable in a competitive environment where clarity can drive action.
For only $0.99, this slide is ready for instant download and compatible with both PowerPoint and Google Slides. You can easily modify it to suit your needs, ensuring that your data presentation is effective and tailored to your specific audience in no time.
$0.99 – Purchase Checkout
Added to cart







