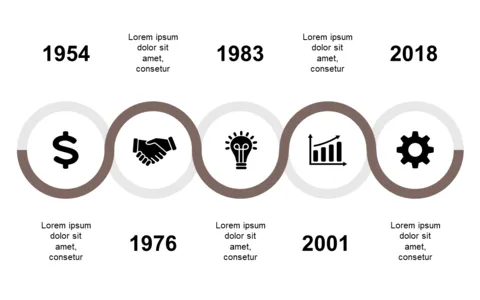
Engage with Circular Milestone Timeline

Product Description
Managing multiple projects can feel overwhelming, especially when you need to keep your team and clients informed of key events. A confusing timeline can lead to misunderstandings and chaos. This circular milestone timeline helps you clearly communicate all important stages and events in an organized, visually appealing way.
Project managers in tech or marketing frequently find themselves in situations where they need to present timelines during sprint reviews or project updates. This slide will fit perfectly in your presentations, making it an ideal choice for anyone needing to show progress in a digestible format.
You’ll appreciate how the design immediately captures attention and clarifies your message. For just $0.99, you can instantly download this slide and start editing it in PowerPoint or Google Slides. It’s designed to be simple to customize, so you can tailor it to fit your specific project needs in minutes.
$0.99 – Purchase Checkout
Added to cart