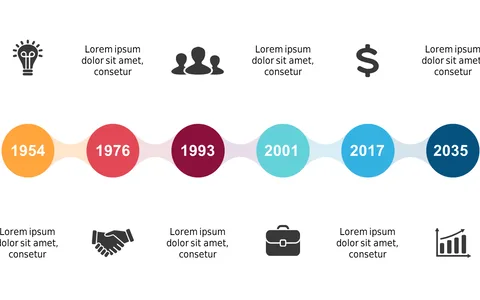
Track Projects with Stepped Timeline Layout

Product Description
Keeping track of multiple projects can feel like juggling too many balls in the air, especially when you need to provide a clear update on each one’s progress. This stepped timeline layout breaks down project phases into easily digestible visuals, making your communication straightforward and effective. Your team will appreciate the clarity when discussing timelines and deadlines.
Project managers in software development or marketing teams will find this layout particularly useful during weekly status meetings or project kick-offs. It’s perfect for illustrating where each project stands relative to others, or for stakeholder updates when clarity is crucial.
You’ll feel confident presenting complex timelines in an organized way. For just $0.99, you can download this slide and start impressing your audience in minutes. It’s fully editable in PowerPoint and Google Slides, allowing you to customize it to fit your project needs with ease.
$0.99 – Purchase Checkout
Added to cart