Showcase Cyclical Workflows with Cycle Diagram V2
Product Description
In a fast-paced work environment, it can be tough to convey cyclical workflows clearly and concisely. When your audience has multiple things on their minds, a cluttered visual can cloud your message.
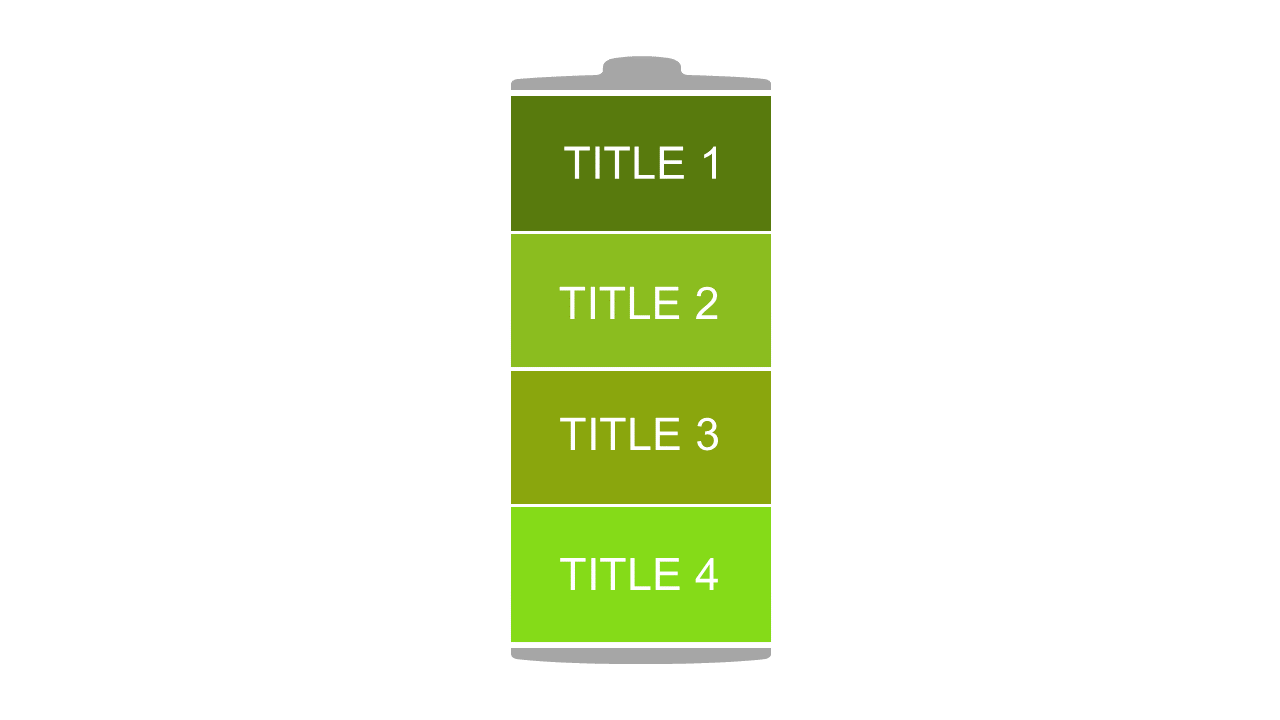
This colorful cycle diagram helps you illustrate iterative processes in a way that grabs attention and keeps everyone engaged. This slide is ideal for product managers running demos during agile sprint reviews, educators presenting curriculum cycles, or sales teams discussing their ongoing outreach strategies. It serves various industries and roles, making it a versatile tool for anyone needing to demonstrate cycles clearly in their presentations.
Available for only $0.99, this slide is ready for instant download and can be easily edited in both PowerPoint and Google Slides. Customize it to match your brand and make your presentations shine in minutes.
$0.99 – Purchase Checkout
Added to cart







