Highlight Iterative Processes with Cycle Diagram
Product Description
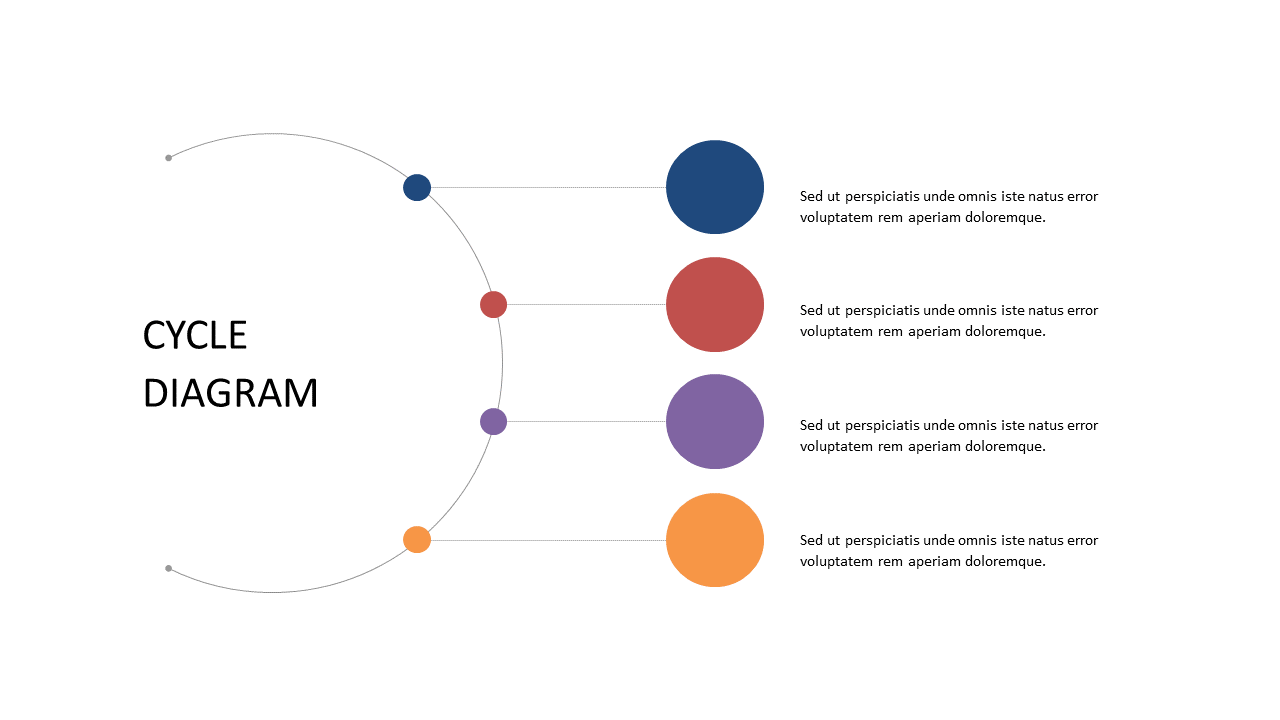
Navigating complex workflows can feel overwhelming, especially when you need to show how different phases interact in an iterative process. Confusing visuals can lead to misunderstandings, making it harder for your audience to grasp the overall flow. This cycle diagram provides a clear and engaging solution, allowing you to communicate those intricate processes effectively.
You can use this slide in various settings, such as project updates for software developers outlining their sprint cycles, or during marketing strategy sessions where you need to explain iterative campaigns. It’s perfect for business analysts presenting data cycles or operations managers discussing process improvements.
Whatever the scenario, this diagram will help your audience follow along effortlessly. For just $0.99, you can download this slide instantly and begin editing it in PowerPoint or Google Slides. It’s designed for quick customization, so you can fit it to your specific needs in no time.
$0.99 – Purchase Checkout
Added to cart







