Track Project Tasks with Horizontal Gantt Chart
Product Description
Keeping track of numerous project tasks and deadlines can create a major headache. Without a clear view of where everything stands, it’s easy for things to slip through the cracks and for your team to lose focus.
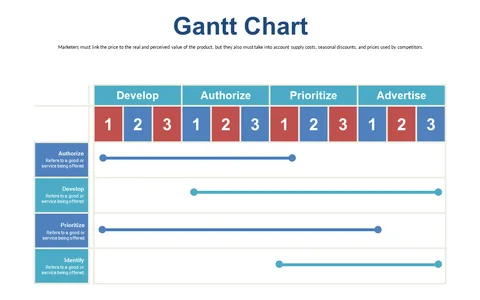
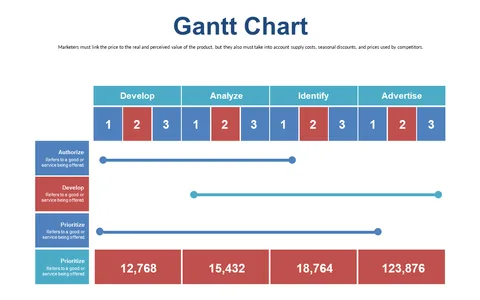
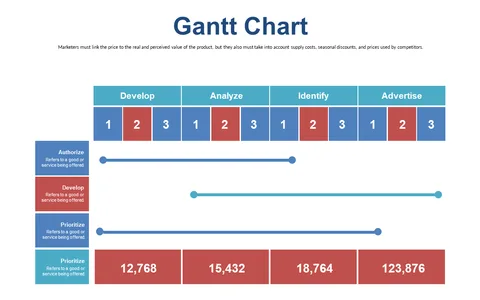
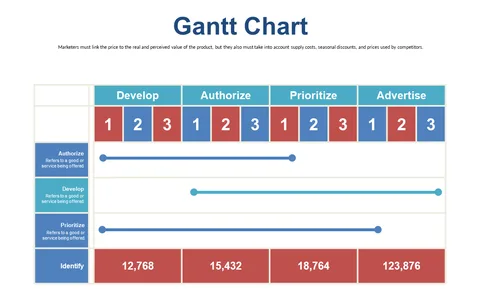
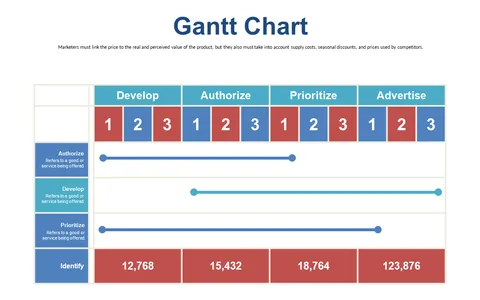
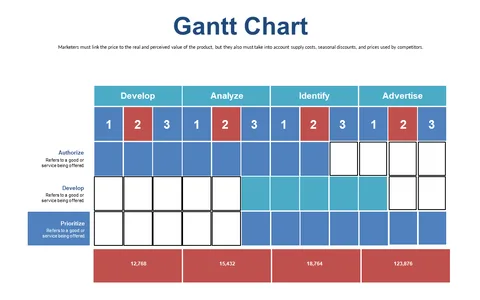
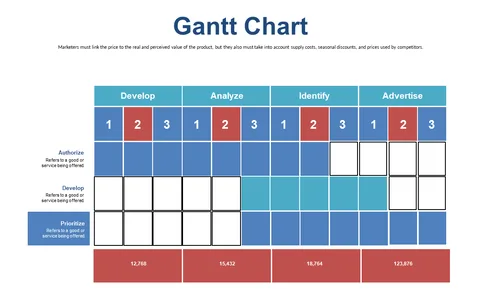
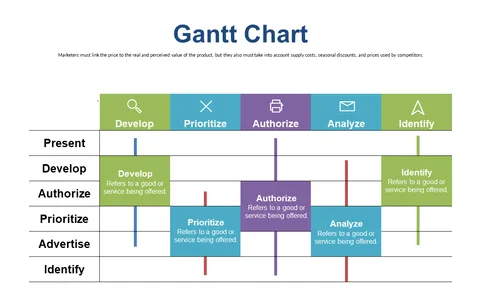
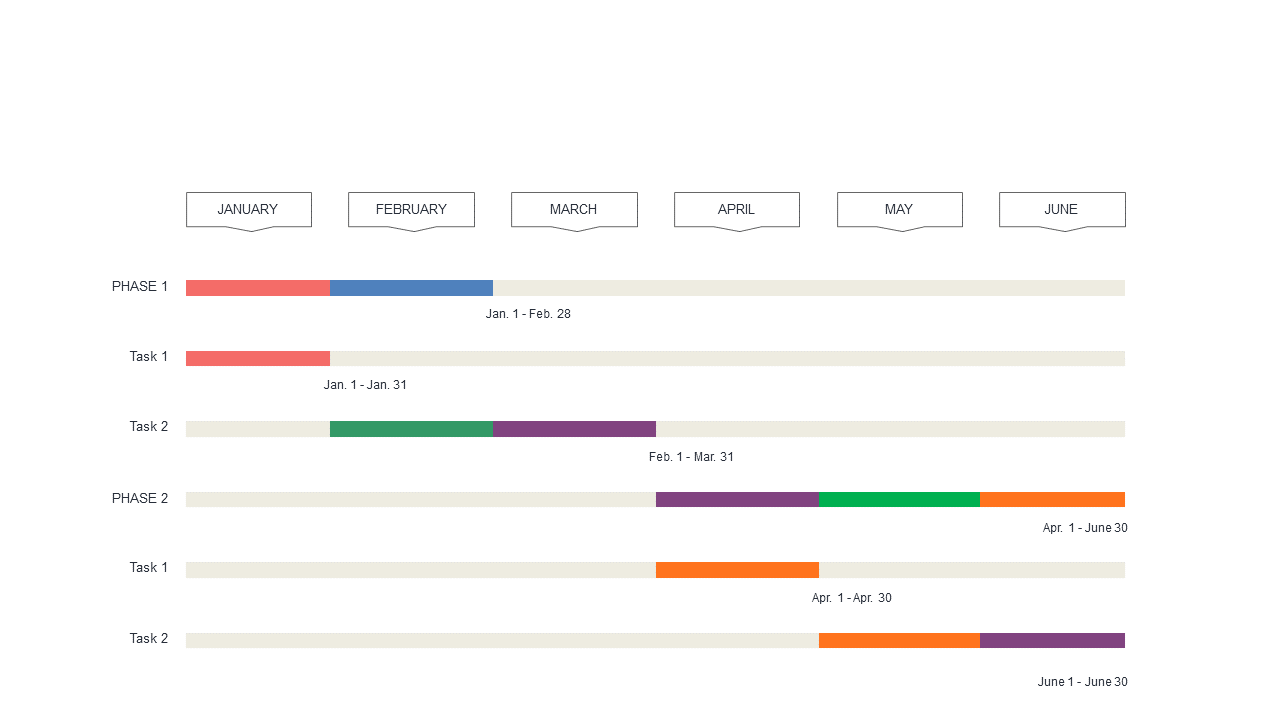
This horizontal Gantt chart provides a straightforward way to visualize project timelines and tasks, making it easier to see overall progress. Ideal for project managers, product owners, and operations specialists, this chart is perfect for planning meetings, sprint reviews, or stakeholder updates. It allows you to show how various tasks relate to each other and can help you pinpoint potential bottlenecks before they become a problem, ensuring that your projects stay on track.
At just $0.99, this slide is ready for immediate download and can be customized in both PowerPoint and Google Slides. Editing is a breeze, so you can ensure that it fits your unique project needs in no time.
$0.99 – Purchase Checkout
Added to cart