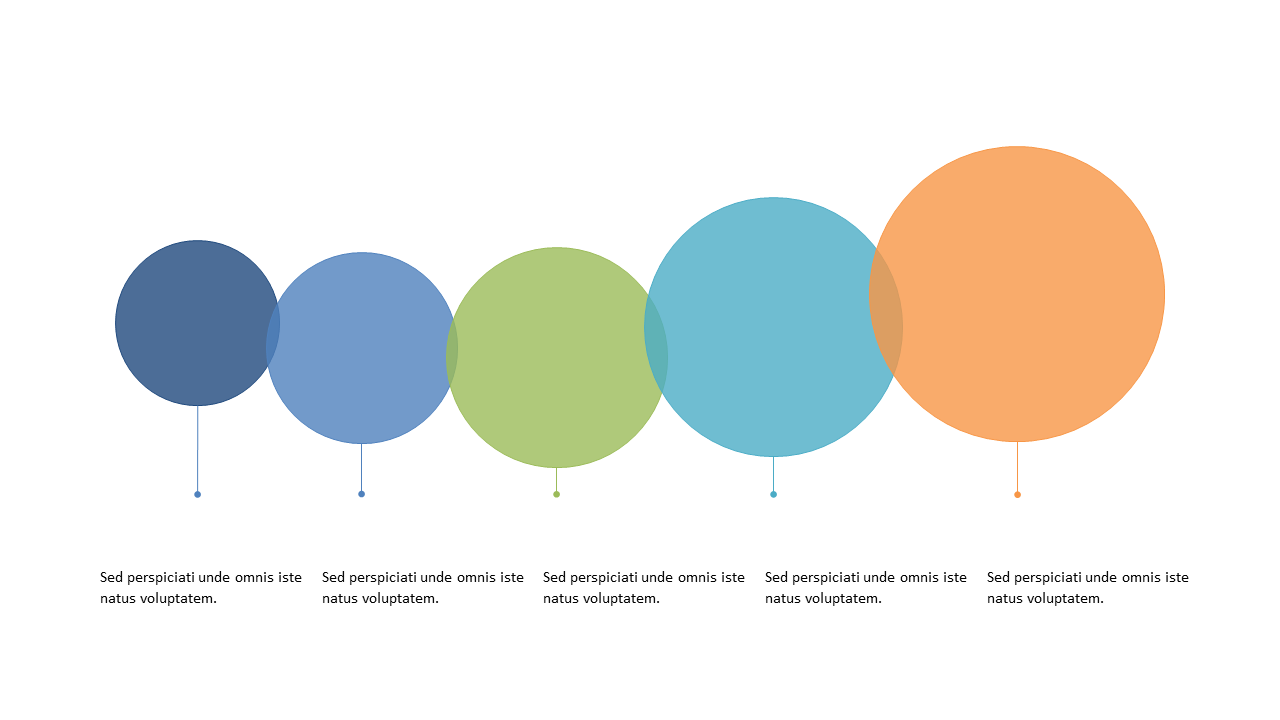
Engage Audience with Colorful Bubble Chart
Product Description
Keeping your audience engaged with complex data can often feel like a balancing act. This colorful bubble chart simplifies that challenge by visually representing your data in an engaging manner that makes insights clearer and more compelling.
Bright colors combined with intuitive design ensure your audience stays focused on your important points. This slide is ideal for data analysts, financial planners, or sales professionals who need to present trends, forecasts, or performance metrics. Use it in quarterly reviews, sales performance updates, or any scenario where data needs to tell a story without overwhelming your audience.
For just $0.99, you can download this slide and edit it to suit your specific data presentation. It’s ready to use immediately in PowerPoint or Google Slides, making it easy to customize and share.
$0.99 – Purchase Checkout
Added to cart







