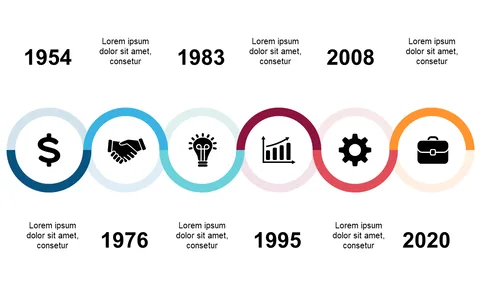
Highlight Project Phases with Timeline Layout

Product Description
When managing complex projects, clearly presenting timelines can be a significant challenge. This slide addresses that need by showcasing a straightforward visual layout that outlines distinct project phases, ensuring clarity for everyone involved.
Perfect for project coordinators, team leaders, or even executives during strategic planning sessions, this slide helps you effectively communicate project timelines during kick-off meetings, status updates, or annual reviews. It allows for easy understanding of key milestones and their interdependencies.
For just $0.99, this slide is ready for instant download and can be quickly edited in PowerPoint or Google Slides. You’ll find that tailoring it to your project’s specifics can be done in mere minutes, making it an essential asset for your presentations.
$0.99 – Purchase Checkout
Added to cart