Present Data Trends with Dotted Line Graph
Product Description
Presenting data trends in a way that is both clear and engaging can be tough, especially when your audience is busy and distracted. If your current presentations are losing impact, this slide can be your go-to resource.
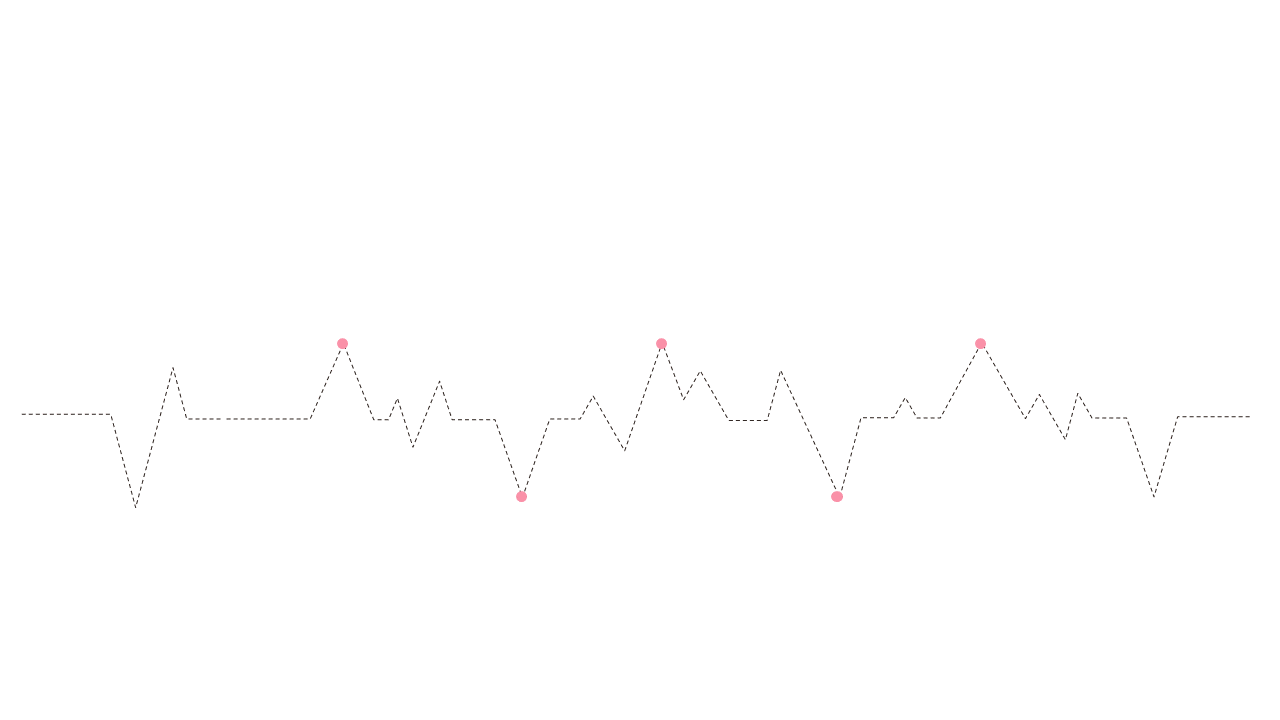
Featuring a visually appealing dotted line graph, it simplifies complex data into easily digestible trends over time. Analysts, marketers, and project managers will find this slide invaluable during quarterly reviews, sales presentations, or strategic planning meetings. When you need to showcase performance metrics or market trends, this graph provides a visual representation that enhances understanding and retention.
Available for just $0.99, this slide is ready for instant download and can be effortlessly edited in PowerPoint or Google Slides. You’ll be able to adapt it to your specific data needs and make your presentations shine in no time.
$0.99 – Purchase Checkout
Added to cart







