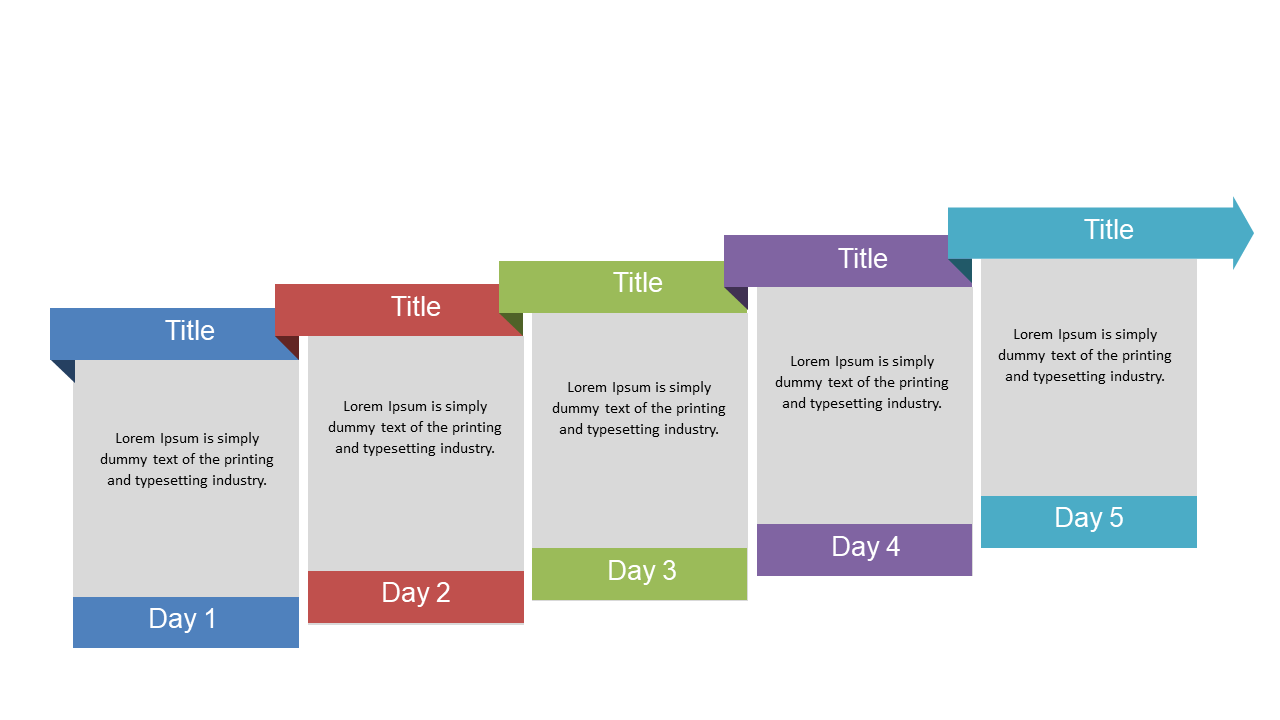
Visualize Project Phases with 5-Step Timeline
Product Description
Managing multiple projects often leads to confusion about timelines and phases. You need a way to visually represent project milestones that is both clear and organized, allowing team members to stay on track and understand their roles in the process.
This slide delivers a straightforward 5-step horizontal timeline to make that challenge easier. Project managers in tech firms or marketing teams running campaigns can benefit greatly from this slide when presenting project timelines during status meetings. It’s also ideal for consultants who need to illustrate project phases to clients or board members, ensuring everyone is aware of key deadlines and deliverables.
You can download this slide for just $0.99, and it’s ready to edit in both PowerPoint and Google Slides. Get started in minutes to create a meaningful visual that keeps your projects in focus.
$0.99 – Purchase Checkout
Added to cart