Compare Metrics with Dual Bar Charts and Flow Arrows
Product Description
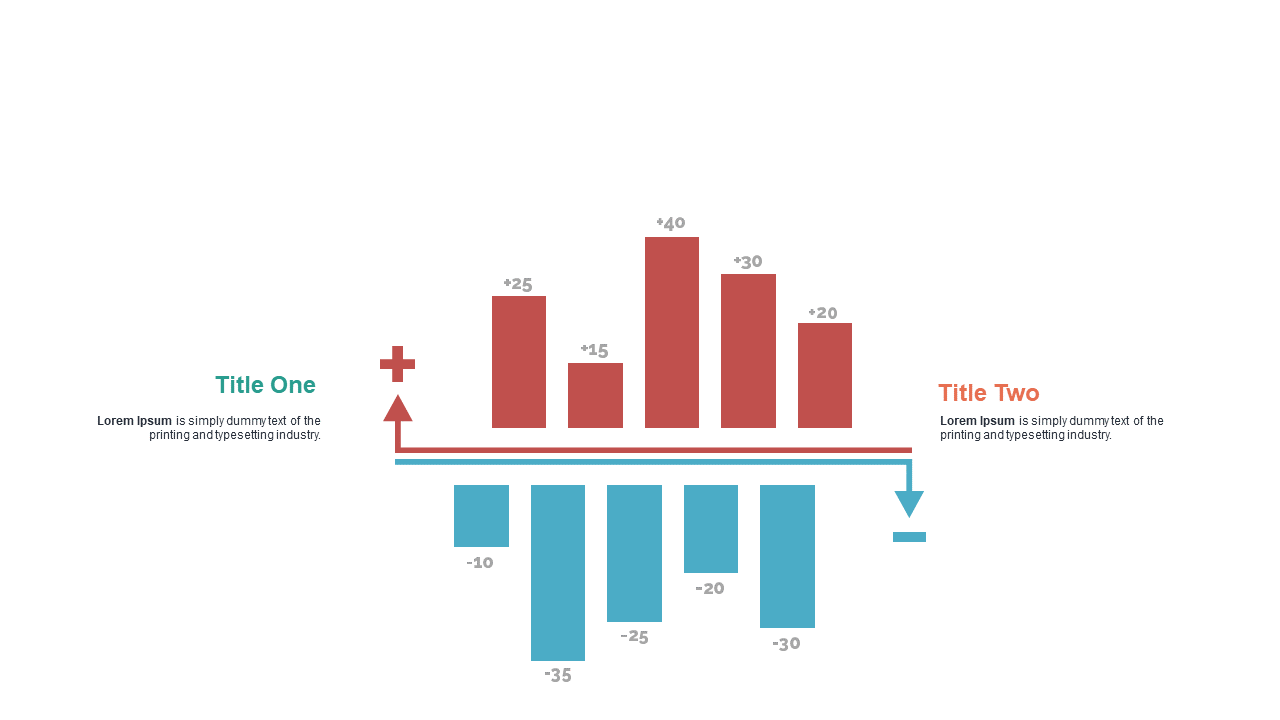
When it comes to presenting comparative metrics, clarity is key, but that’s not always easy to achieve. This slide simplifies your task by using dual bar charts and flow arrows to display data side-by-side, making important comparisons instantly visible. You’ll feel confident knowing your audience can easily grasp the insights you’re sharing.
This slide is perfect for marketing analysts or project managers presenting performance metrics in team meetings or client pitches. It’s also useful in industries like manufacturing or tech, where precise comparisons can make or break a proposal. With its focused design, you’ll convey your message with precision and impact.
For only $0.99, this slide is available for immediate download so
you can customize it right away. It’s compatible with both PowerPoint and Google Slides, making it easy to adapt to your presentation style in just minutes.
$0.99 – Purchase Checkout
Added to cart







