Display Annual Financial Trends with Stacked Bar Graph
Product Description
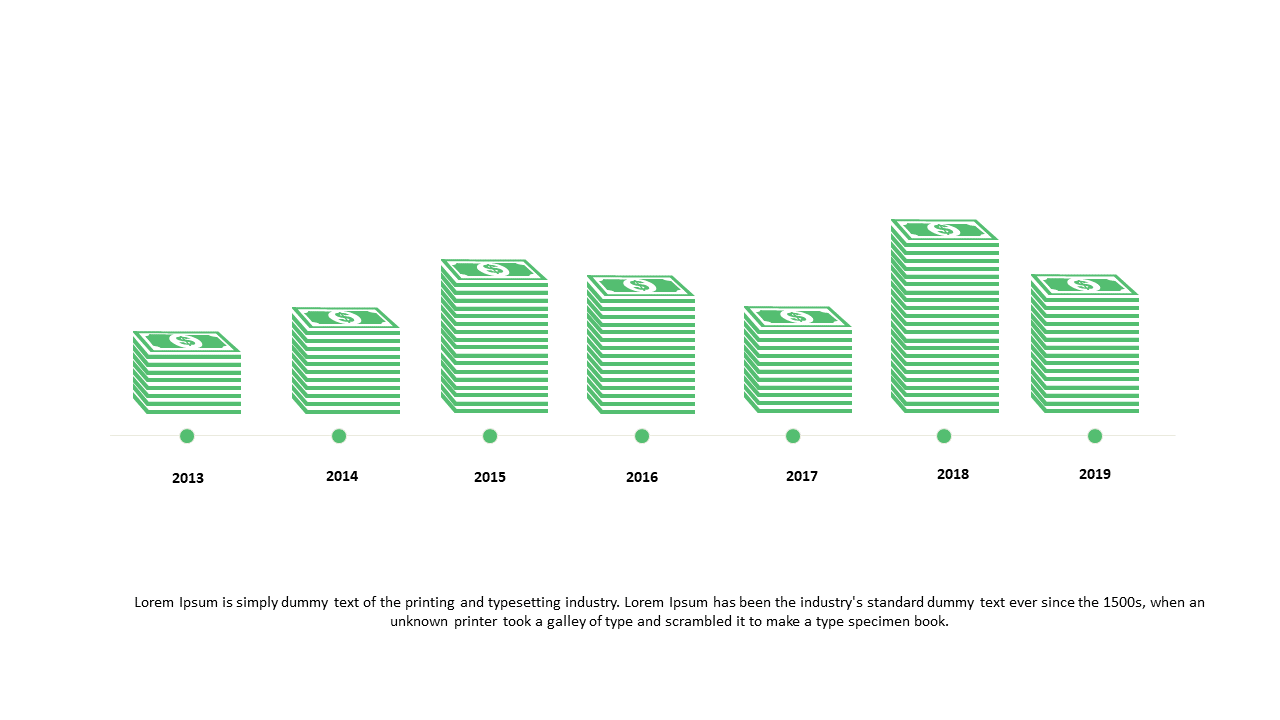
When the pressure is on to present annual financial trends, you need a visual that cuts through the noise. This stacked bar graph provides a clear snapshot of financial performance over the years, allowing your audience to grasp key trends and fluctuations without getting lost in a sea of numbers. It’s designed to help you communicate effectively and confidently.
Finance managers and analysts will find this slide particularly useful during end-of-year reports or quarterly business reviews. It’s perfect for stakeholders in sectors like corporate finance or retail, where visualizing historical data can significantly impact decision-making.
Whether you’re pitching to executives or preparing for a team meeting, this slide fits right in. At just $0.99, you can easily download this slide and customize it to fit your needs. It’s fully editable in PowerPoint and Google Slides, so you can make adjustments in minutes and be ready for your presentation.
$0.99 – Purchase Checkout
Added to cart







