Present Data Insights with 3D Exploded Pie Chart
Product Description
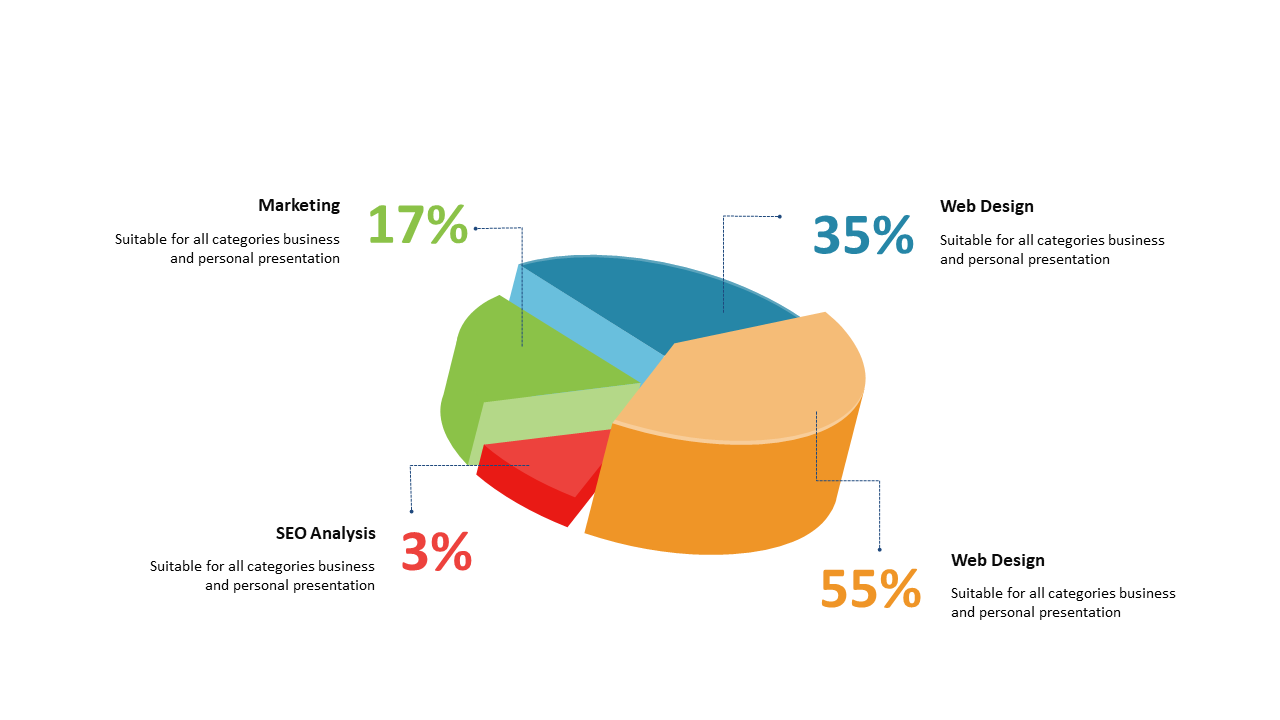
Conveying data insights can often feel like a balancing act between clarity and detail, especially when you want your audience to truly understand the information being presented. This 3D exploded pie chart makes it simple to showcase complex data visually, breaking it down into easily understandable segments with percentage labels for instant clarity.
Data analysts, finance professionals, and business consultants will find this slide invaluable for presentations involving market analysis, financial reports, or trend reviews. It’s designed to grab attention and clearly communicate essential insights, making your findings resonate with your audience.
For only $0.99, this slide is ready for immediate download. It’s fully editable in PowerPoint and Google Slides, allowing for quick customization so you can tailor it to fit your specific data and presentation style seamlessly.
$0.99 – Purchase Checkout
Added to cart







