Show Performance Metrics with Horizontal Bar Graph
Product Description
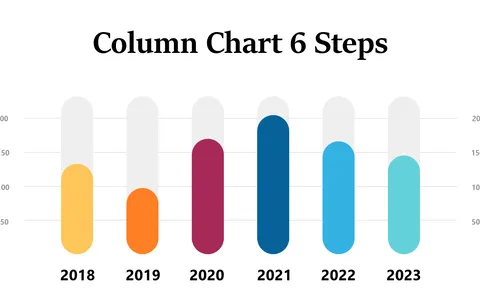
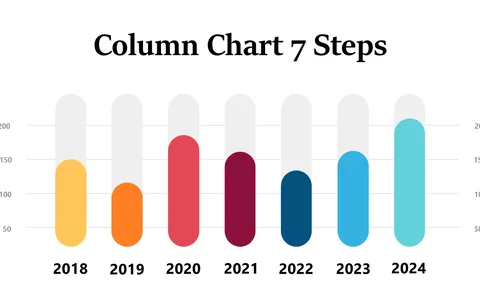
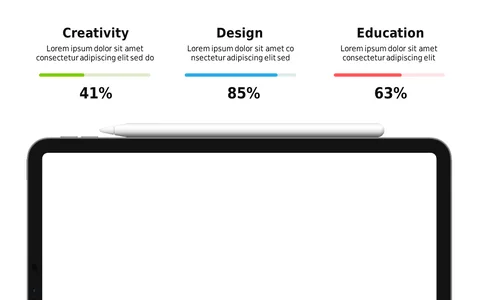
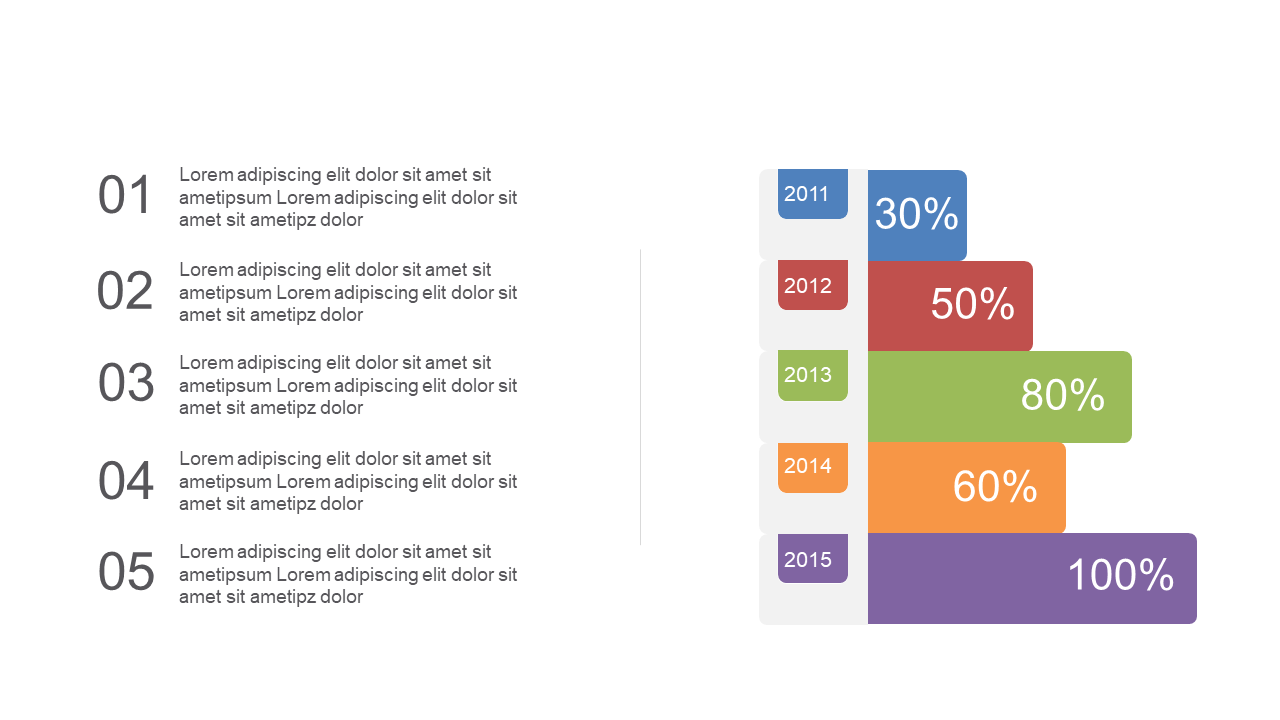
Data analysts often struggle to make complex performance metrics accessible and engaging for their audience. Without the right visuals, your vital insights risk going unheard. This horizontal bar graph slide transforms that challenge by presenting colorful segments and percentage labels, making your data easy to interpret.
You’ll find this slide useful in various contexts, whether you’re a business analyst presenting KPI results, a team lead showcasing project outcomes, or an operations manager discussing efficiency metrics. The clear layout helps your audience to quickly identify key performance areas and understand the overall picture without getting lost in the details.
For just $0.99, this slide is available for instant download and is designed for easy editing in both PowerPoint and Google Slides.
You can customize it quickly to fit your specific needs and have a polished presentation ready in no time.
$0.99 – Purchase Checkout
Added to cart