Analyze Trends with Multi-Series Line Charts
Product Description
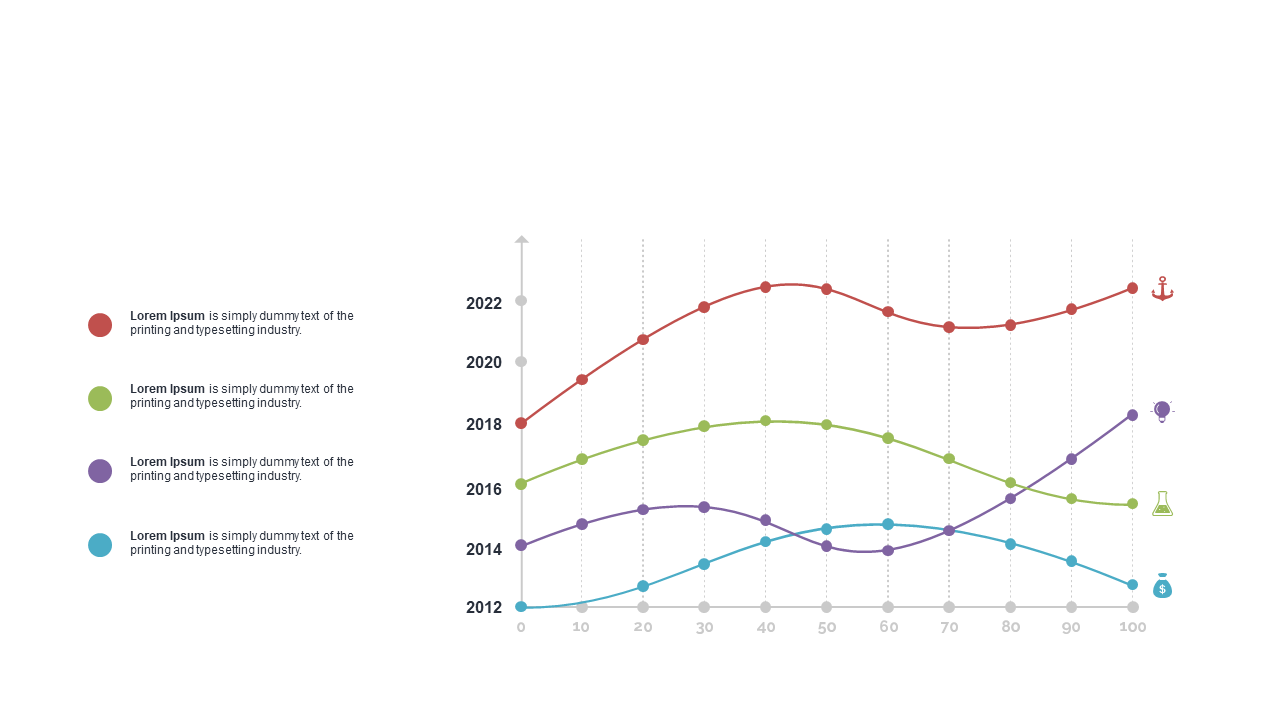
Effectively conveying multiple data trends can be challenging, especially when you want your audience to stay focused. This multi-series line chart is designed to present complex information in a straightforward and visually appealing way.
It allows your audience to quickly grasp the trends that matter most without getting lost in details. This slide is ideal for financial analysts showcasing market trends, business developers tracking growth metrics, or project managers analyzing timelines. It works well in presentations focused on performance reviews, strategic planning, or status updates, where data clarity is key.
Available for just $0.99, this slide is ready for instant download and can be easily customized in PowerPoint or Google Slides. You can have it tailored to your needs in just minutes!
$0.99 – Purchase Checkout
Added to cart







