Analyze Yearly Trends with Vertical Bar Charts
Product Description
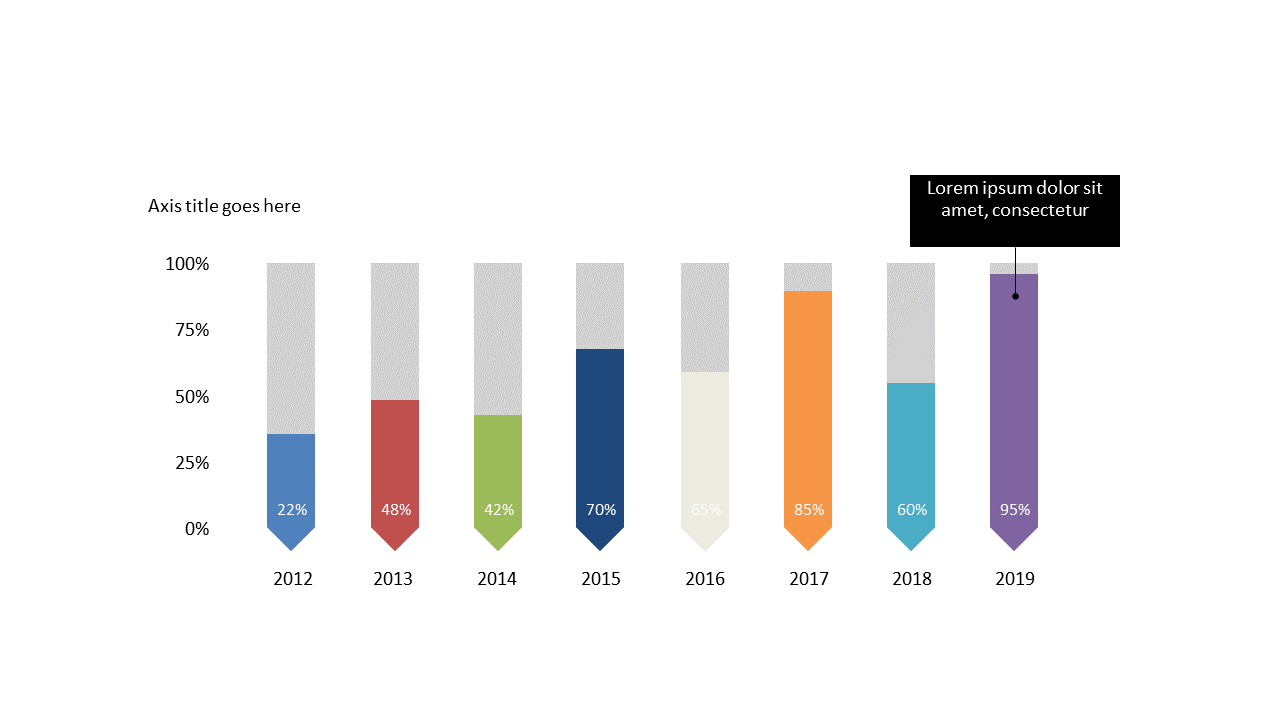
As a reporting manager, you often need to convey complex data in a way that’s easy to understand. This slide provides a clean and straightforward vertical bar chart that displays percentage data across multiple years, allowing you to highlight trends and performance metrics with clarity. Visually, the slide presents a well-structured bar chart that can be customized easily to fit your color scheme and to adjust labels according to your specific data.
For data analysts, this slide serves as an excellent tool to present findings during team meetings or strategy sessions. You can use it to showcase how key metrics have shifted over time, making your analysis more impactful. Likewise, finance leads will find this slide invaluable for fiscal reviews, enabling them to illustrate financial performance effectively and drive discussion.
Customization is simple—adjust colors and labels to align with your branding or to emphasize specific data points.
$0.99 —
add this single slide to any deck from the SlideSwift Slide Library. No subscription needed. Mix slides from any category to build your perfect deck.
$0.99 – Purchase Checkout
Added to cart







