Engage with Horizontal Bar Chart for Data Comparisons
Product Description
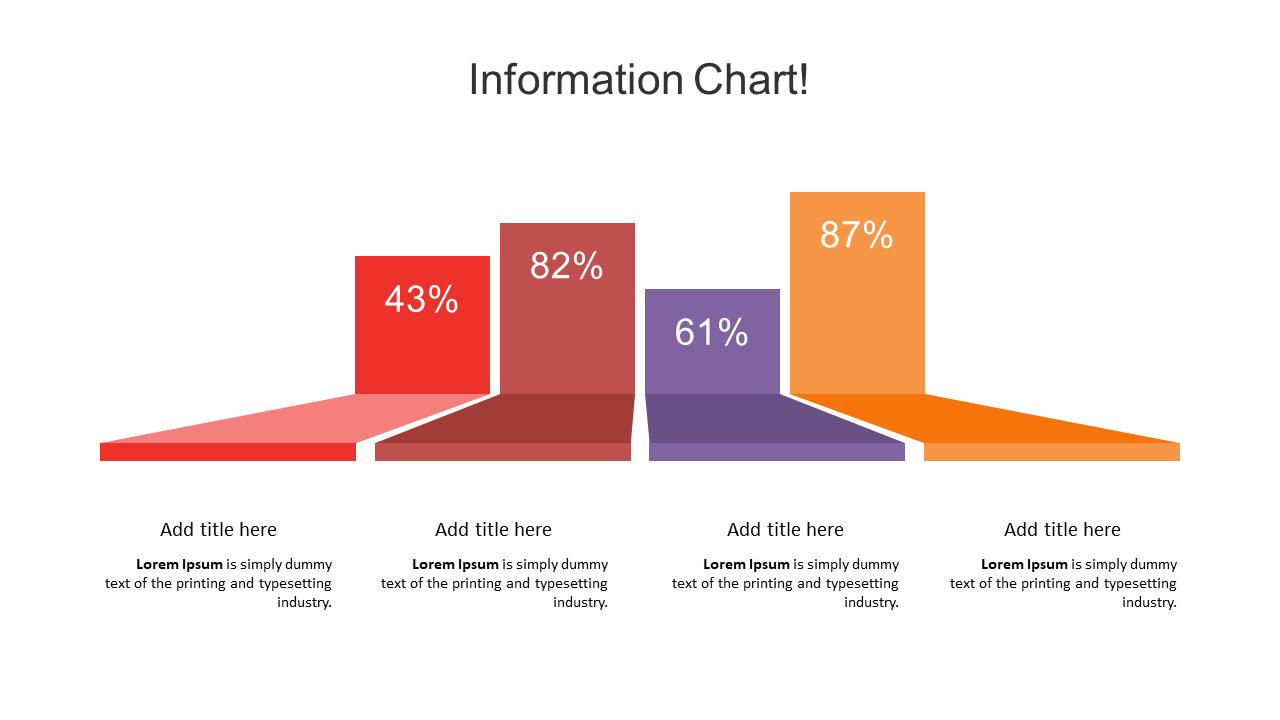
In today’s fast-paced business environment, conveying complex data clearly is more important than ever. This horizontal bar chart makes data comparisons simple and visually striking, allowing your audience to quickly grasp essential information.
It transforms your data into an easily interpretable format that encourages better communication. Great for data analysts, marketing executives, and team coordinators, this slide is ideal for quarterly strategy meetings, product launch reviews, or competitive analysis briefings. You’ll find it particularly effective for showcasing survey results, sales figures, or project timelines, enabling clear comparisons at a glance.
For just $0.99, you can instantly download this effective slide, which is fully editable in PowerPoint and Google Slides. It’s designed to save you valuable time, ensuring you can focus on delivering your message powerfully and effectively.
$0.99 – Purchase Checkout
Added to cart







