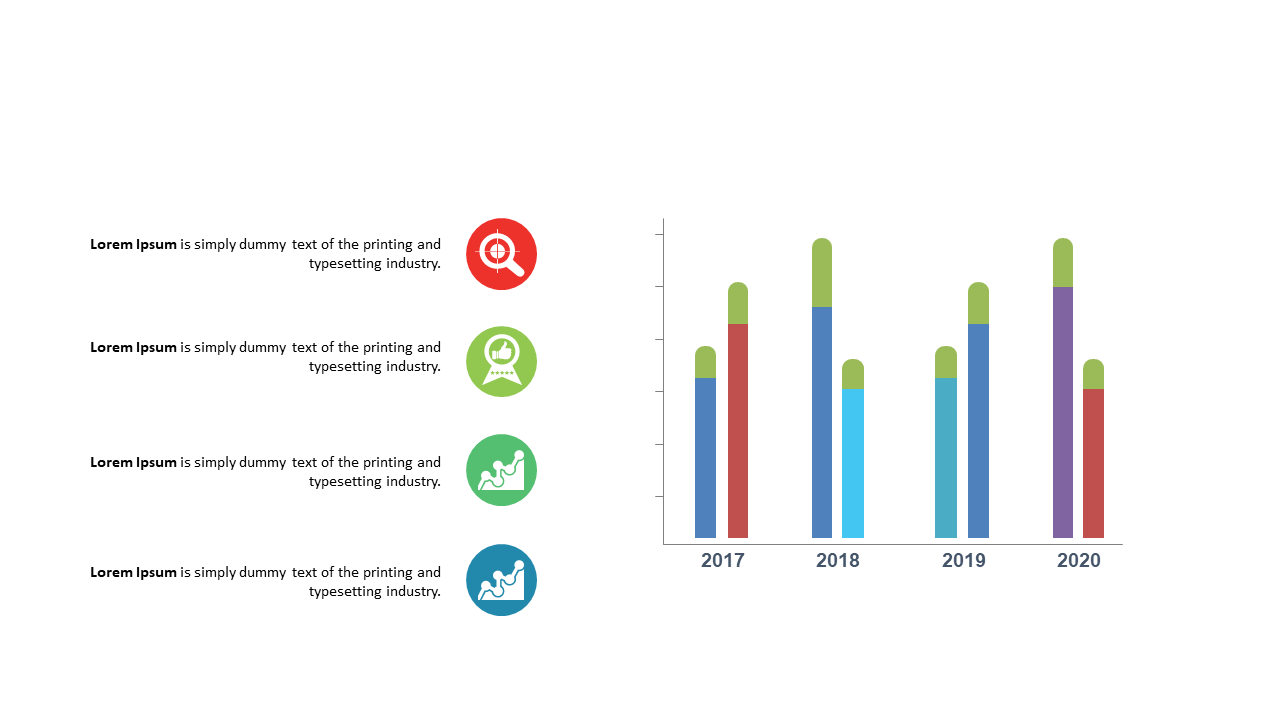
Engage Audience with Vertical Bar Chart and Icons
Product Description
In today’s fast-paced world, grabbing your audience’s attention while presenting data can be a real challenge. You need visuals that are not only informative but also engaging to keep your listeners focused.
This slide helps you achieve that with a vertical bar chart complemented by icons, designed to enhance your storytelling. Data analysts, project managers, and business consultants across diverse fields can use this slide for presentations in strategy meetings, data reviews, or client pitches. It allows you to present complex data in a straightforward manner, making it easier for your audience to absorb key insights at a glance.
Available for just $0.99, this slide is ready for instant download and can be easily edited in PowerPoint and Google Slides. You’ll have a polished and engaging visual ready for your next meeting within minutes.
$0.99 – Purchase Checkout
Added to cart







