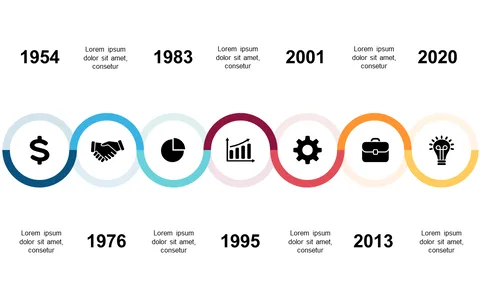
Showcase Achievements with Linear Timeline Layout

Product Description
Highlighting key milestones within a project is crucial, but doing it in a way that captures your audience’s attention can often be a struggle. This linear timeline layout allows you to showcase achievements clearly, making it simple for everyone to follow your progress at a glance.
It transforms data-heavy updates into engaging visuals that resonate. This slide is ideal for project managers, business analysts, and sales leads during quarterly presentations, project kick-offs, or client updates. It serves as a powerful visual aid to succinctly highlight crucial accomplishments and provide context for future steps, ensuring everyone is on the same page.
For just $0.99, you can download this slide instantly and customize it using PowerPoint or Google Slides. It’s quick to edit and will help present your project milestones in a polished and professional manner, saving you valuable time.
$0.99 – Purchase Checkout
Added to cart