Present Financial Projections with Yearly Milestone Timeline
Product Description
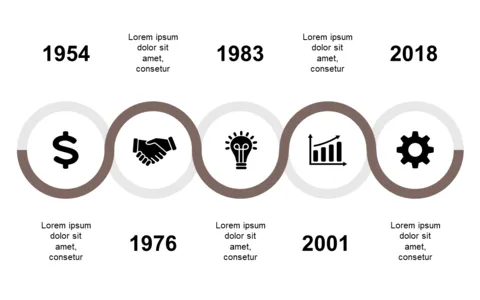
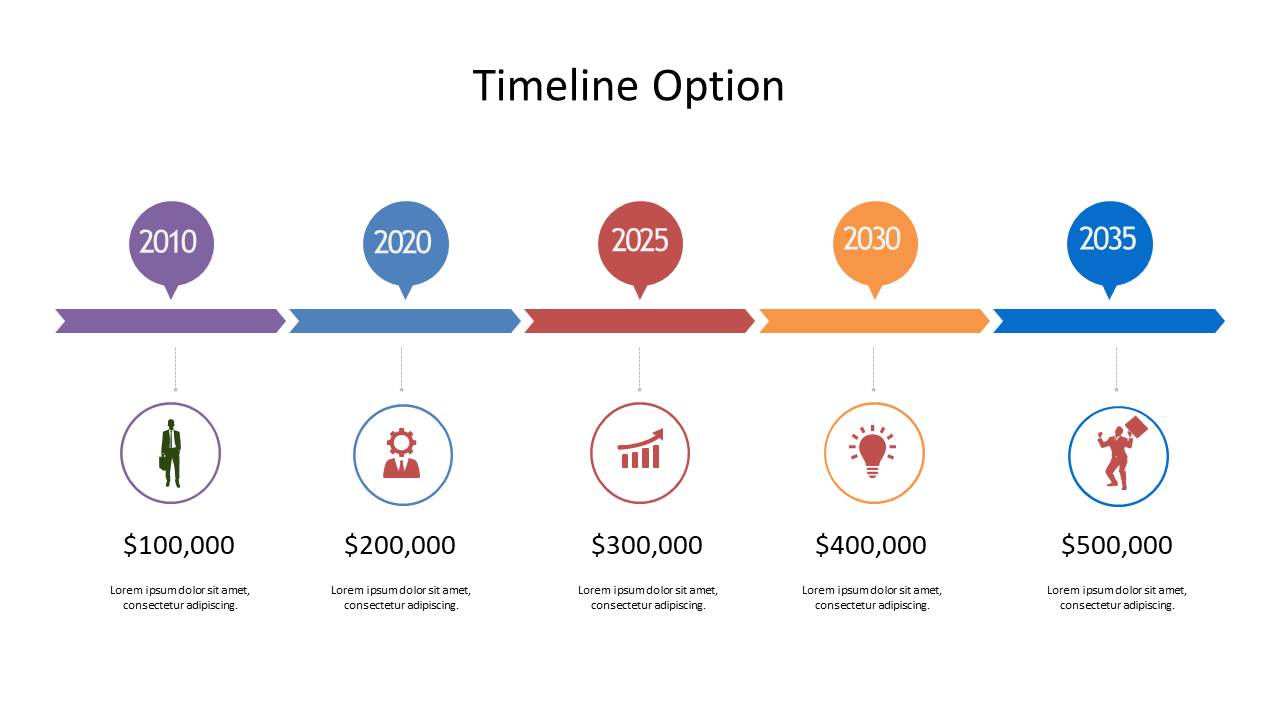
As an operations manager, conveying financial projections clearly is vital, but it can often feel cumbersome. This slide presents a timeline with circular data points that highlight key years and corresponding financial values, keeping your audience focused on your projections while maintaining clarity.
The clean design helps to ensure your message isn’t lost in complex data. Financial analysts, budget managers, and executive teams can all effectively use this slide during annual reviews, financial strategy meetings, or board presentations. It serves as an excellent tool for breaking down financial data in a visually appealing way, making it more accessible for everyone involved.
For just $0.99, this slide is ready for instant download and can be quickly edited in PowerPoint or Google Slides. You can adjust it to perfectly align with your data presentation needs in no time.
$0.99 – Purchase Checkout
Added to cart