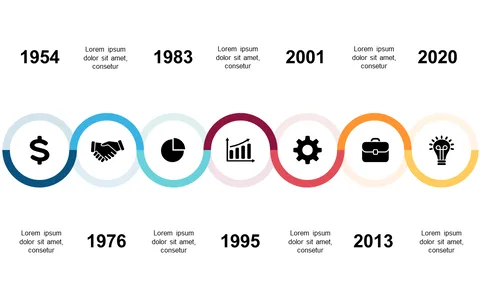
Showcase Key Milestones with a Three-Point Timeline

Product Description
As an operations manager, conveying project timelines can sometimes feel overwhelming, especially when you want to keep your audience engaged. This three-point timeline slide offers a straightforward design that highlights significant milestones with visually appealing icons. It’s an effective way to communicate your project’s progress without losing your audience’s attention.
This slide is perfect for use in operational reviews or team updates, particularly in manufacturing or logistics sectors where timelines are crucial for success. You can present it in meetings to track projects or during presentations to summarize key achievements clearly.
It ensures everyone understands the timeline at a glance. For only $0.99, you can download this slide instantly, and it’s fully editable in PowerPoint and Google Slides. Customize it to fit your needs and get ready to present in just a few minutes.
$0.99 – Purchase Checkout
Added to cart