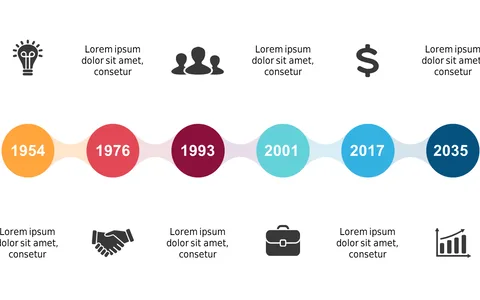
Highlight Key Achievements with a Horizontal Timeline V6
Product Description
In fast-paced environments, effectively showcasing project progress can often get lost in translation. With this horizontal timeline slide, you can clearly highlight key achievements and deliverables, making it easier for your audience to follow along.
The colorful markers and percentage indicators draw attention to each milestone, ensuring nothing goes unnoticed. This slide is a great fit for operations managers discussing quarterly results or project leads in any industry providing updates in client meetings. It’s also an invaluable tool for executives during board presentations, where clear communication of achievements is vital for decision-making.
At just $0.99, this slide is available for instant download and can be easily edited to fit your specific project needs. You can work with it in PowerPoint or Google Slides, making customization quick and straightforward.
$0.99 – Purchase Checkout
Added to cart